Tsimshian vs Cambodian In Labor Force | Age 20-24
COMPARE
Tsimshian
Cambodian
In Labor Force | Age 20-24
In Labor Force | Age 20-24 Comparison
Tsimshian
Cambodians
72.3%
IN LABOR FORCE | AGE 20-24
0.0/ 100
METRIC RATING
309th/ 347
METRIC RANK
75.2%
IN LABOR FORCE | AGE 20-24
60.5/ 100
METRIC RATING
166th/ 347
METRIC RANK
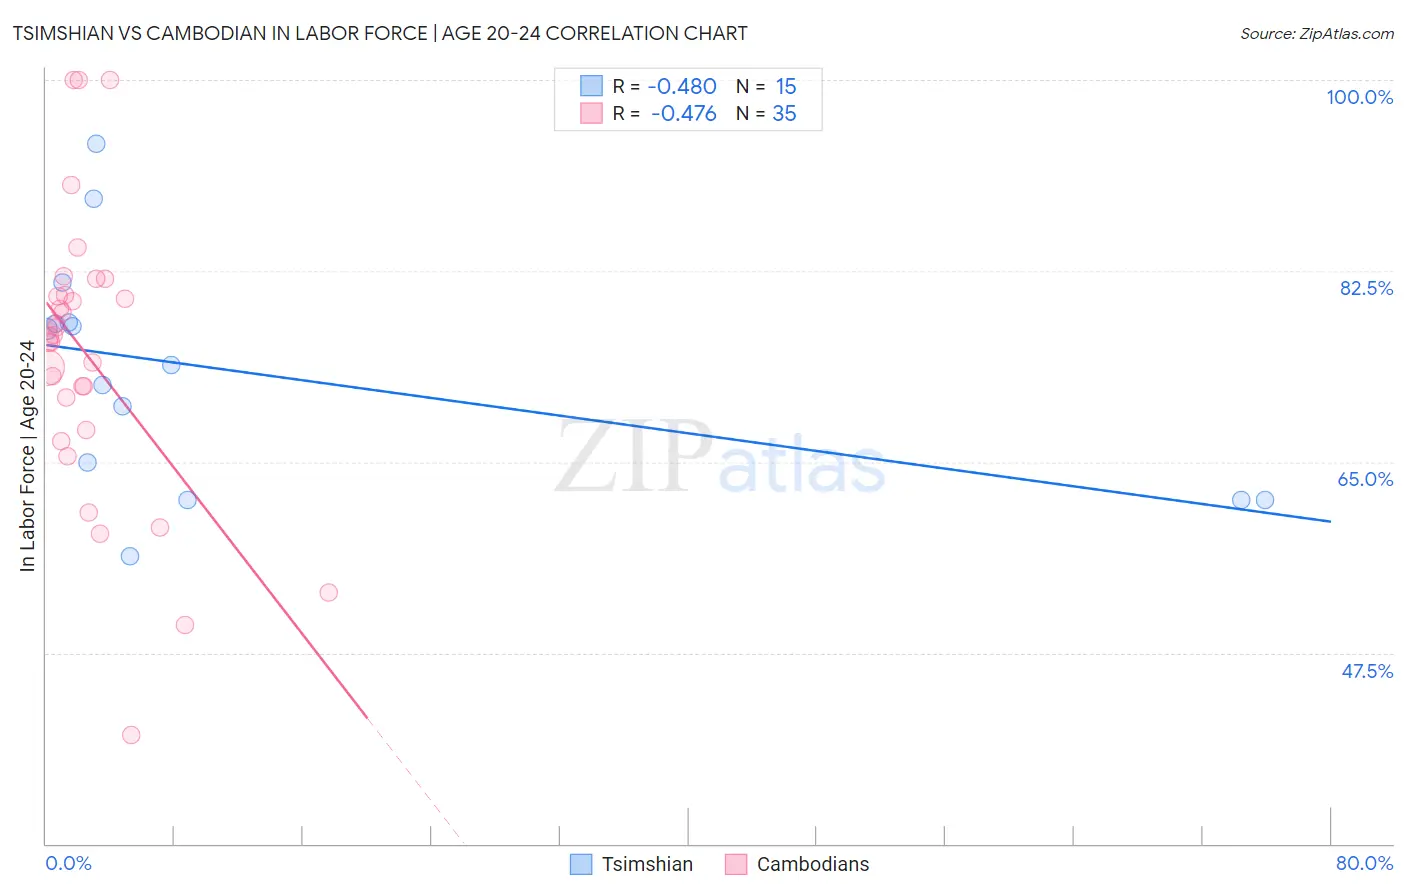
Tsimshian vs Cambodian In Labor Force | Age 20-24 Correlation Chart
The statistical analysis conducted on geographies consisting of 15,626,462 people shows a moderate negative correlation between the proportion of Tsimshian and labor force participation rate among population between the ages 20 and 24 in the United States with a correlation coefficient (R) of -0.480 and weighted average of 72.3%. Similarly, the statistical analysis conducted on geographies consisting of 102,513,868 people shows a moderate negative correlation between the proportion of Cambodians and labor force participation rate among population between the ages 20 and 24 in the United States with a correlation coefficient (R) of -0.476 and weighted average of 75.2%, a difference of 4.0%.
In Labor Force | Age 20-24 Correlation Summary
| Measurement | Tsimshian | Cambodian |
| Minimum | 56.3% | 40.0% |
| Maximum | 94.1% | 100.0% |
| Range | 37.8% | 60.0% |
| Mean | 73.1% | 74.7% |
| Median | 73.9% | 76.5% |
| Interquartile 25% (IQ1) | 61.5% | 68.0% |
| Interquartile 75% (IQ3) | 77.8% | 80.3% |
| Interquartile Range (IQR) | 16.3% | 12.4% |
| Standard Deviation (Sample) | 10.7% | 13.1% |
| Standard Deviation (Population) | 10.4% | 12.9% |
Similar Demographics by In Labor Force | Age 20-24
Demographics Similar to Tsimshian by In Labor Force | Age 20-24
In terms of in labor force | age 20-24, the demographic groups most similar to Tsimshian are Soviet Union (72.3%, a difference of 0.0%), Immigrants from Ecuador (72.3%, a difference of 0.010%), Immigrants from Jamaica (72.4%, a difference of 0.16%), Immigrants from Singapore (72.4%, a difference of 0.19%), and Immigrants from West Indies (72.4%, a difference of 0.21%).
| Demographics | Rating | Rank | In Labor Force | Age 20-24 |
| Natives/Alaskans | 0.0 /100 | #302 | Tragic 72.4% |
| Ecuadorians | 0.0 /100 | #303 | Tragic 72.4% |
| Immigrants | West Indies | 0.0 /100 | #304 | Tragic 72.4% |
| Immigrants | Singapore | 0.0 /100 | #305 | Tragic 72.4% |
| Immigrants | Jamaica | 0.0 /100 | #306 | Tragic 72.4% |
| Immigrants | Ecuador | 0.0 /100 | #307 | Tragic 72.3% |
| Soviet Union | 0.0 /100 | #308 | Tragic 72.3% |
| Tsimshian | 0.0 /100 | #309 | Tragic 72.3% |
| Immigrants | Cuba | 0.0 /100 | #310 | Tragic 72.0% |
| Apache | 0.0 /100 | #311 | Tragic 72.0% |
| Immigrants | Caribbean | 0.0 /100 | #312 | Tragic 71.9% |
| Immigrants | Dominica | 0.0 /100 | #313 | Tragic 71.9% |
| Indians (Asian) | 0.0 /100 | #314 | Tragic 71.9% |
| Immigrants | Iran | 0.0 /100 | #315 | Tragic 71.8% |
| Immigrants | Eastern Asia | 0.0 /100 | #316 | Tragic 71.8% |
Demographics Similar to Cambodians by In Labor Force | Age 20-24
In terms of in labor force | age 20-24, the demographic groups most similar to Cambodians are Immigrants from South Eastern Asia (75.1%, a difference of 0.040%), Bolivian (75.2%, a difference of 0.050%), Afghan (75.2%, a difference of 0.050%), Immigrants from Romania (75.2%, a difference of 0.060%), and Costa Rican (75.2%, a difference of 0.060%).
| Demographics | Rating | Rank | In Labor Force | Age 20-24 |
| South American Indians | 69.0 /100 | #159 | Good 75.3% |
| Japanese | 68.7 /100 | #160 | Good 75.3% |
| New Zealanders | 65.4 /100 | #161 | Good 75.2% |
| Immigrants | Romania | 64.6 /100 | #162 | Good 75.2% |
| Costa Ricans | 64.2 /100 | #163 | Good 75.2% |
| Bolivians | 64.0 /100 | #164 | Good 75.2% |
| Afghans | 63.5 /100 | #165 | Good 75.2% |
| Cambodians | 60.5 /100 | #166 | Good 75.2% |
| Immigrants | South Eastern Asia | 57.5 /100 | #167 | Average 75.1% |
| Immigrants | Western Africa | 56.7 /100 | #168 | Average 75.1% |
| Immigrants | Philippines | 55.8 /100 | #169 | Average 75.1% |
| Mexicans | 52.1 /100 | #170 | Average 75.1% |
| Cajuns | 51.1 /100 | #171 | Average 75.1% |
| Yakama | 50.8 /100 | #172 | Average 75.1% |
| Immigrants | Croatia | 50.2 /100 | #173 | Average 75.1% |