Belizean vs Cambodian In Labor Force | Age 20-24
COMPARE
Belizean
Cambodian
In Labor Force | Age 20-24
In Labor Force | Age 20-24 Comparison
Belizeans
Cambodians
73.4%
IN LABOR FORCE | AGE 20-24
0.3/ 100
METRIC RATING
272nd/ 347
METRIC RANK
75.2%
IN LABOR FORCE | AGE 20-24
60.5/ 100
METRIC RATING
166th/ 347
METRIC RANK
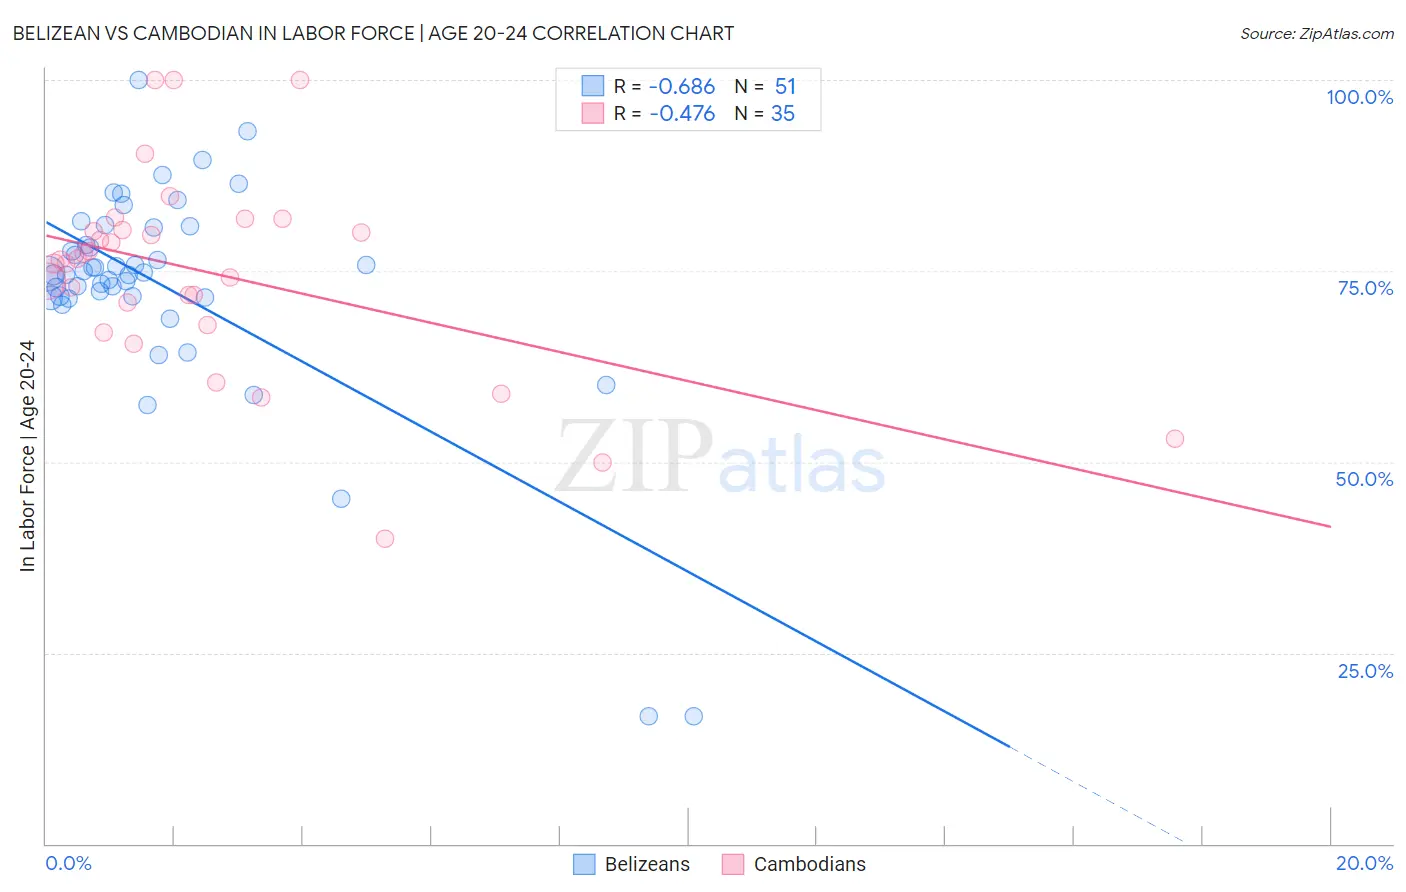
Belizean vs Cambodian In Labor Force | Age 20-24 Correlation Chart
The statistical analysis conducted on geographies consisting of 144,207,582 people shows a significant negative correlation between the proportion of Belizeans and labor force participation rate among population between the ages 20 and 24 in the United States with a correlation coefficient (R) of -0.686 and weighted average of 73.4%. Similarly, the statistical analysis conducted on geographies consisting of 102,513,868 people shows a moderate negative correlation between the proportion of Cambodians and labor force participation rate among population between the ages 20 and 24 in the United States with a correlation coefficient (R) of -0.476 and weighted average of 75.2%, a difference of 2.4%.
In Labor Force | Age 20-24 Correlation Summary
| Measurement | Belizean | Cambodian |
| Minimum | 16.7% | 40.0% |
| Maximum | 100.0% | 100.0% |
| Range | 83.3% | 60.0% |
| Mean | 73.0% | 74.7% |
| Median | 74.6% | 76.5% |
| Interquartile 25% (IQ1) | 71.5% | 68.0% |
| Interquartile 75% (IQ3) | 80.8% | 80.3% |
| Interquartile Range (IQR) | 9.3% | 12.4% |
| Standard Deviation (Sample) | 14.6% | 13.1% |
| Standard Deviation (Population) | 14.5% | 12.9% |
Similar Demographics by In Labor Force | Age 20-24
Demographics Similar to Belizeans by In Labor Force | Age 20-24
In terms of in labor force | age 20-24, the demographic groups most similar to Belizeans are Immigrants from Indonesia (73.4%, a difference of 0.010%), Cheyenne (73.4%, a difference of 0.030%), Immigrants from Colombia (73.4%, a difference of 0.050%), Immigrants from Russia (73.5%, a difference of 0.060%), and Colombian (73.5%, a difference of 0.10%).
| Demographics | Rating | Rank | In Labor Force | Age 20-24 |
| Burmese | 0.5 /100 | #265 | Tragic 73.6% |
| Haitians | 0.5 /100 | #266 | Tragic 73.6% |
| Immigrants | Western Asia | 0.4 /100 | #267 | Tragic 73.5% |
| South Americans | 0.4 /100 | #268 | Tragic 73.5% |
| Colombians | 0.3 /100 | #269 | Tragic 73.5% |
| Immigrants | Russia | 0.3 /100 | #270 | Tragic 73.5% |
| Immigrants | Indonesia | 0.3 /100 | #271 | Tragic 73.4% |
| Belizeans | 0.3 /100 | #272 | Tragic 73.4% |
| Cheyenne | 0.2 /100 | #273 | Tragic 73.4% |
| Immigrants | Colombia | 0.2 /100 | #274 | Tragic 73.4% |
| Immigrants | South America | 0.2 /100 | #275 | Tragic 73.3% |
| Mongolians | 0.2 /100 | #276 | Tragic 73.3% |
| Immigrants | Malaysia | 0.2 /100 | #277 | Tragic 73.3% |
| Cypriots | 0.2 /100 | #278 | Tragic 73.3% |
| Venezuelans | 0.2 /100 | #279 | Tragic 73.3% |
Demographics Similar to Cambodians by In Labor Force | Age 20-24
In terms of in labor force | age 20-24, the demographic groups most similar to Cambodians are Immigrants from South Eastern Asia (75.1%, a difference of 0.040%), Bolivian (75.2%, a difference of 0.050%), Afghan (75.2%, a difference of 0.050%), Immigrants from Romania (75.2%, a difference of 0.060%), and Costa Rican (75.2%, a difference of 0.060%).
| Demographics | Rating | Rank | In Labor Force | Age 20-24 |
| South American Indians | 69.0 /100 | #159 | Good 75.3% |
| Japanese | 68.7 /100 | #160 | Good 75.3% |
| New Zealanders | 65.4 /100 | #161 | Good 75.2% |
| Immigrants | Romania | 64.6 /100 | #162 | Good 75.2% |
| Costa Ricans | 64.2 /100 | #163 | Good 75.2% |
| Bolivians | 64.0 /100 | #164 | Good 75.2% |
| Afghans | 63.5 /100 | #165 | Good 75.2% |
| Cambodians | 60.5 /100 | #166 | Good 75.2% |
| Immigrants | South Eastern Asia | 57.5 /100 | #167 | Average 75.1% |
| Immigrants | Western Africa | 56.7 /100 | #168 | Average 75.1% |
| Immigrants | Philippines | 55.8 /100 | #169 | Average 75.1% |
| Mexicans | 52.1 /100 | #170 | Average 75.1% |
| Cajuns | 51.1 /100 | #171 | Average 75.1% |
| Yakama | 50.8 /100 | #172 | Average 75.1% |
| Immigrants | Croatia | 50.2 /100 | #173 | Average 75.1% |