Immigrants from Dominica vs Immigrants from Belarus In Labor Force | Age > 16
COMPARE
Immigrants from Dominica
Immigrants from Belarus
In Labor Force | Age > 16
In Labor Force | Age > 16 Comparison
Immigrants from Dominica
Immigrants from Belarus
64.5%
IN LABOR FORCE | AGE > 16
3.5/ 100
METRIC RATING
241st/ 347
METRIC RANK
65.2%
IN LABOR FORCE | AGE > 16
66.0/ 100
METRIC RATING
167th/ 347
METRIC RANK
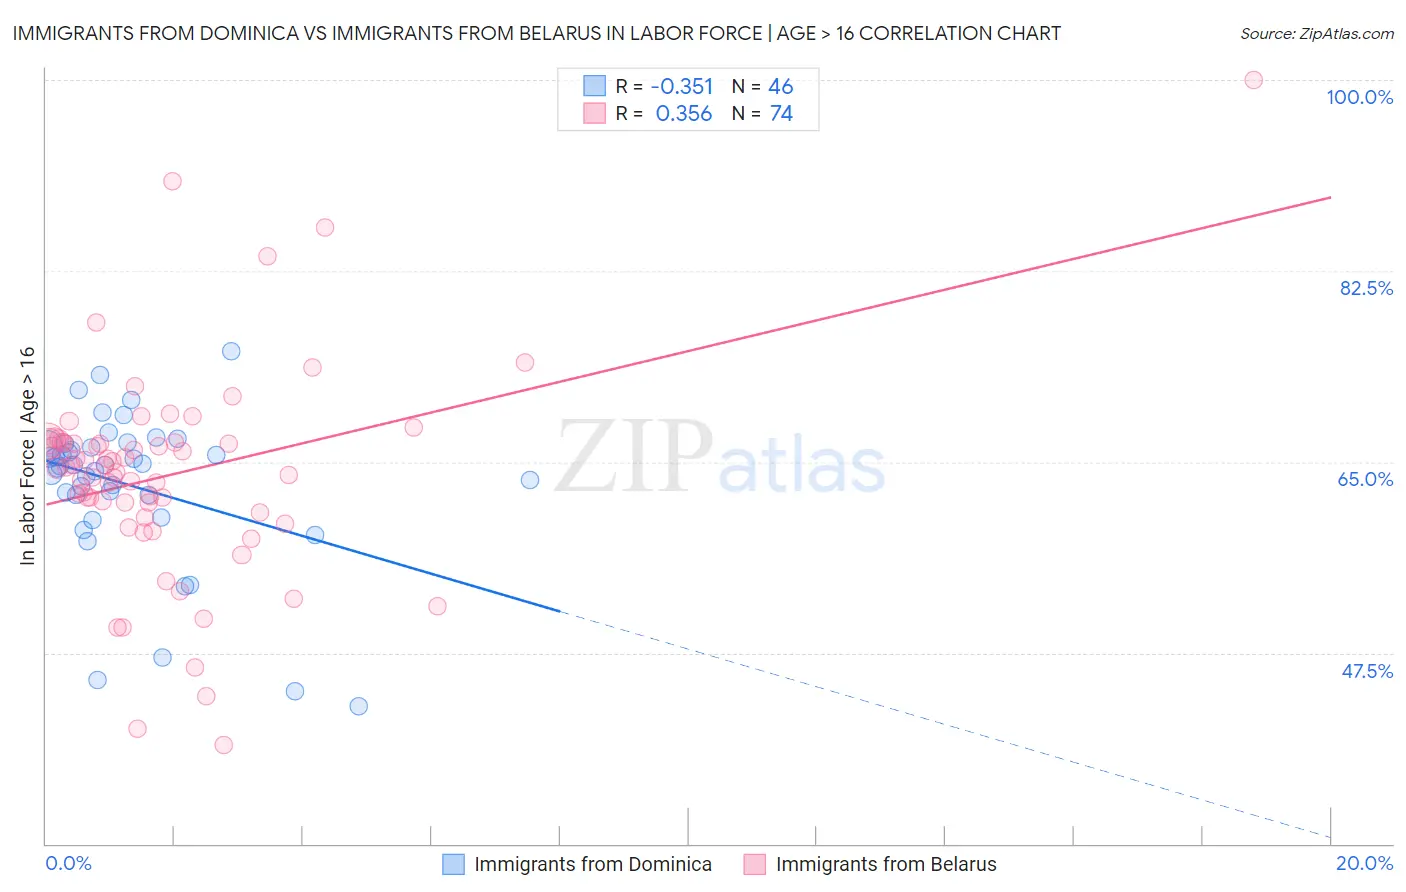
Immigrants from Dominica vs Immigrants from Belarus In Labor Force | Age > 16 Correlation Chart
The statistical analysis conducted on geographies consisting of 83,796,433 people shows a mild negative correlation between the proportion of Immigrants from Dominica and labor force participation rate among population ages 16 and over in the United States with a correlation coefficient (R) of -0.351 and weighted average of 64.5%. Similarly, the statistical analysis conducted on geographies consisting of 150,205,158 people shows a mild positive correlation between the proportion of Immigrants from Belarus and labor force participation rate among population ages 16 and over in the United States with a correlation coefficient (R) of 0.356 and weighted average of 65.2%, a difference of 1.1%.
In Labor Force | Age > 16 Correlation Summary
| Measurement | Immigrants from Dominica | Immigrants from Belarus |
| Minimum | 42.6% | 39.1% |
| Maximum | 75.1% | 100.0% |
| Range | 32.5% | 60.9% |
| Mean | 62.8% | 63.8% |
| Median | 64.7% | 64.5% |
| Interquartile 25% (IQ1) | 62.0% | 60.4% |
| Interquartile 75% (IQ3) | 66.6% | 66.8% |
| Interquartile Range (IQR) | 4.6% | 6.4% |
| Standard Deviation (Sample) | 7.1% | 9.7% |
| Standard Deviation (Population) | 7.0% | 9.7% |
Similar Demographics by In Labor Force | Age > 16
Demographics Similar to Immigrants from Dominica by In Labor Force | Age > 16
In terms of in labor force | age > 16, the demographic groups most similar to Immigrants from Dominica are Immigrants from Bangladesh (64.5%, a difference of 0.0%), Immigrants from Netherlands (64.5%, a difference of 0.010%), Immigrants from Hungary (64.5%, a difference of 0.020%), Lebanese (64.5%, a difference of 0.030%), and Immigrants from Lebanon (64.5%, a difference of 0.030%).
| Demographics | Rating | Rank | In Labor Force | Age > 16 |
| Vietnamese | 4.7 /100 | #234 | Tragic 64.6% |
| Austrians | 4.6 /100 | #235 | Tragic 64.6% |
| Immigrants | Norway | 4.6 /100 | #236 | Tragic 64.6% |
| Italians | 4.6 /100 | #237 | Tragic 64.6% |
| Lebanese | 3.9 /100 | #238 | Tragic 64.5% |
| Immigrants | Hungary | 3.8 /100 | #239 | Tragic 64.5% |
| Immigrants | Bangladesh | 3.6 /100 | #240 | Tragic 64.5% |
| Immigrants | Dominica | 3.5 /100 | #241 | Tragic 64.5% |
| Immigrants | Netherlands | 3.4 /100 | #242 | Tragic 64.5% |
| Immigrants | Lebanon | 3.2 /100 | #243 | Tragic 64.5% |
| Tsimshian | 3.1 /100 | #244 | Tragic 64.5% |
| West Indians | 3.0 /100 | #245 | Tragic 64.5% |
| Immigrants | Caribbean | 2.3 /100 | #246 | Tragic 64.4% |
| Swiss | 2.1 /100 | #247 | Tragic 64.4% |
| Immigrants | Barbados | 2.1 /100 | #248 | Tragic 64.4% |
Demographics Similar to Immigrants from Belarus by In Labor Force | Age > 16
In terms of in labor force | age > 16, the demographic groups most similar to Immigrants from Belarus are Immigrants from Western Asia (65.3%, a difference of 0.020%), Immigrants from Kazakhstan (65.3%, a difference of 0.030%), Serbian (65.2%, a difference of 0.030%), Danish (65.3%, a difference of 0.040%), and Arab (65.2%, a difference of 0.040%).
| Demographics | Rating | Rank | In Labor Force | Age > 16 |
| Immigrants | South Africa | 73.5 /100 | #160 | Good 65.3% |
| Australians | 71.3 /100 | #161 | Good 65.3% |
| Albanians | 70.8 /100 | #162 | Good 65.3% |
| South Africans | 69.8 /100 | #163 | Good 65.3% |
| Danes | 68.8 /100 | #164 | Good 65.3% |
| Immigrants | Kazakhstan | 68.1 /100 | #165 | Good 65.3% |
| Immigrants | Western Asia | 67.3 /100 | #166 | Good 65.3% |
| Immigrants | Belarus | 66.0 /100 | #167 | Good 65.2% |
| Serbians | 63.5 /100 | #168 | Good 65.2% |
| Arabs | 62.4 /100 | #169 | Good 65.2% |
| Immigrants | Israel | 61.7 /100 | #170 | Good 65.2% |
| Israelis | 61.6 /100 | #171 | Good 65.2% |
| Immigrants | Sweden | 61.3 /100 | #172 | Good 65.2% |
| Immigrants | Ukraine | 53.7 /100 | #173 | Average 65.1% |
| Macedonians | 50.0 /100 | #174 | Average 65.1% |