Immigrants from Denmark vs Blackfeet In Labor Force | Age 20-64
COMPARE
Immigrants from Denmark
Blackfeet
In Labor Force | Age 20-64
In Labor Force | Age 20-64 Comparison
Immigrants from Denmark
Blackfeet
79.4%
IN LABOR FORCE | AGE 20-64
26.9/ 100
METRIC RATING
192nd/ 347
METRIC RANK
77.0%
IN LABOR FORCE | AGE 20-64
0.0/ 100
METRIC RATING
311th/ 347
METRIC RANK
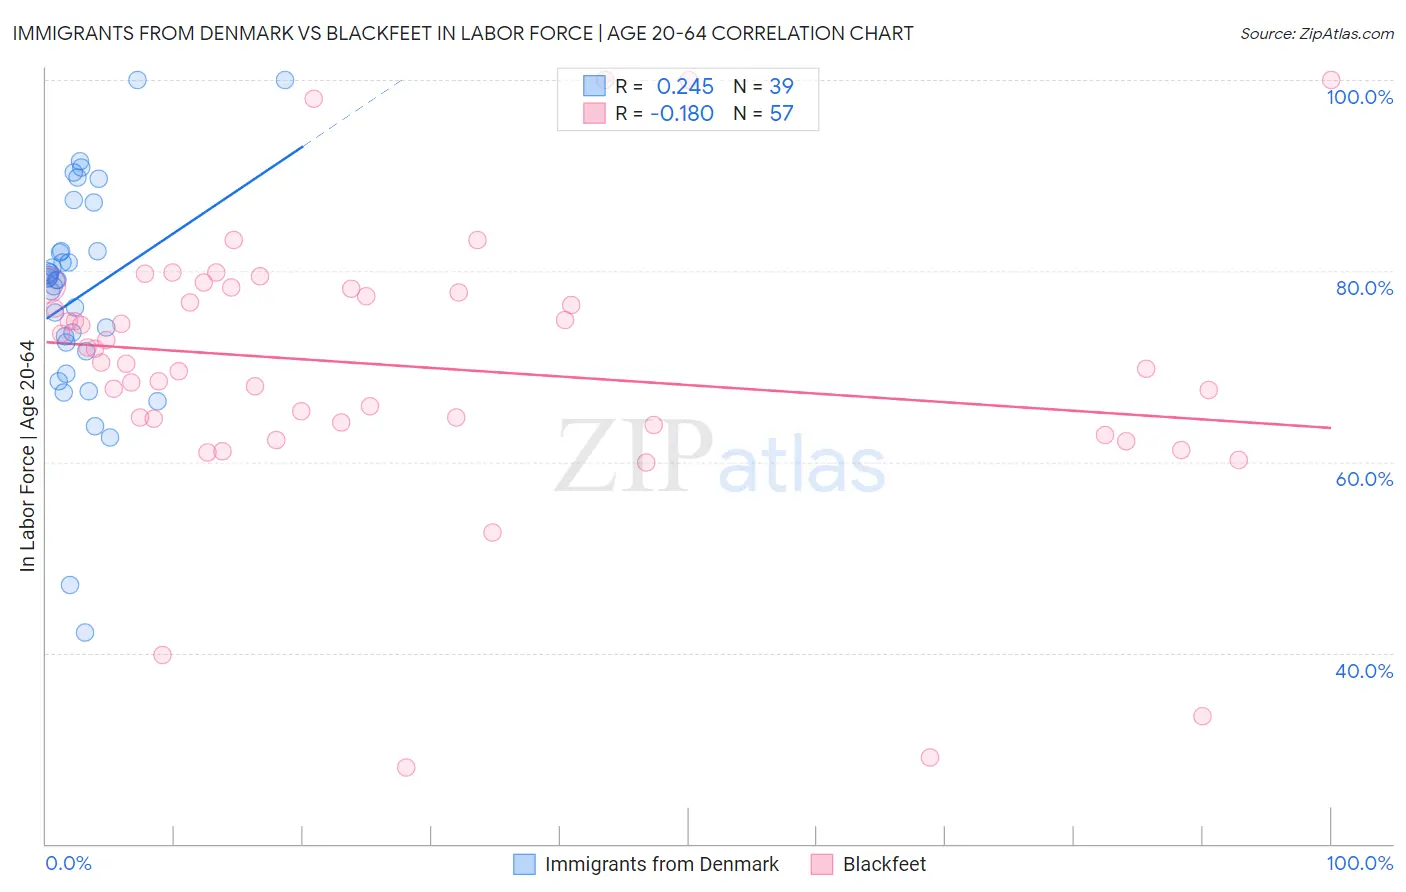
Immigrants from Denmark vs Blackfeet In Labor Force | Age 20-64 Correlation Chart
The statistical analysis conducted on geographies consisting of 136,432,253 people shows a weak positive correlation between the proportion of Immigrants from Denmark and labor force participation rate among population between the ages 20 and 64 in the United States with a correlation coefficient (R) of 0.245 and weighted average of 79.4%. Similarly, the statistical analysis conducted on geographies consisting of 309,562,637 people shows a poor negative correlation between the proportion of Blackfeet and labor force participation rate among population between the ages 20 and 64 in the United States with a correlation coefficient (R) of -0.180 and weighted average of 77.0%, a difference of 3.1%.
In Labor Force | Age 20-64 Correlation Summary
| Measurement | Immigrants from Denmark | Blackfeet |
| Minimum | 42.1% | 28.0% |
| Maximum | 100.0% | 100.0% |
| Range | 57.9% | 72.0% |
| Mean | 77.4% | 70.0% |
| Median | 79.1% | 70.4% |
| Interquartile 25% (IQ1) | 71.6% | 64.0% |
| Interquartile 75% (IQ3) | 82.1% | 77.9% |
| Interquartile Range (IQR) | 10.5% | 14.0% |
| Standard Deviation (Sample) | 11.9% | 14.5% |
| Standard Deviation (Population) | 11.7% | 14.3% |
Similar Demographics by In Labor Force | Age 20-64
Demographics Similar to Immigrants from Denmark by In Labor Force | Age 20-64
In terms of in labor force | age 20-64, the demographic groups most similar to Immigrants from Denmark are Indonesian (79.4%, a difference of 0.010%), Swiss (79.4%, a difference of 0.020%), Immigrants from Thailand (79.4%, a difference of 0.020%), Immigrants from Austria (79.4%, a difference of 0.030%), and Immigrants from El Salvador (79.4%, a difference of 0.040%).
| Demographics | Rating | Rank | In Labor Force | Age 20-64 |
| Israelis | 34.7 /100 | #185 | Fair 79.5% |
| Northern Europeans | 34.5 /100 | #186 | Fair 79.5% |
| Assyrians/Chaldeans/Syriacs | 33.3 /100 | #187 | Fair 79.4% |
| Immigrants | Haiti | 32.1 /100 | #188 | Fair 79.4% |
| Immigrants | El Salvador | 30.9 /100 | #189 | Fair 79.4% |
| Immigrants | Syria | 30.8 /100 | #190 | Fair 79.4% |
| Swiss | 28.9 /100 | #191 | Fair 79.4% |
| Immigrants | Denmark | 26.9 /100 | #192 | Fair 79.4% |
| Indonesians | 26.1 /100 | #193 | Fair 79.4% |
| Immigrants | Thailand | 24.8 /100 | #194 | Fair 79.4% |
| Immigrants | Austria | 23.7 /100 | #195 | Fair 79.4% |
| Ecuadorians | 23.1 /100 | #196 | Fair 79.4% |
| Immigrants | Senegal | 22.5 /100 | #197 | Fair 79.4% |
| Immigrants | Laos | 21.5 /100 | #198 | Fair 79.4% |
| Dutch | 20.2 /100 | #199 | Fair 79.3% |
Demographics Similar to Blackfeet by In Labor Force | Age 20-64
In terms of in labor force | age 20-64, the demographic groups most similar to Blackfeet are Comanche (77.0%, a difference of 0.030%), American (77.0%, a difference of 0.050%), Alaska Native (77.0%, a difference of 0.060%), Central American Indian (77.1%, a difference of 0.11%), and Alaskan Athabascan (76.9%, a difference of 0.17%).
| Demographics | Rating | Rank | In Labor Force | Age 20-64 |
| Immigrants | Mexico | 0.0 /100 | #304 | Tragic 77.3% |
| Mexicans | 0.0 /100 | #305 | Tragic 77.2% |
| Potawatomi | 0.0 /100 | #306 | Tragic 77.2% |
| Central American Indians | 0.0 /100 | #307 | Tragic 77.1% |
| Alaska Natives | 0.0 /100 | #308 | Tragic 77.0% |
| Americans | 0.0 /100 | #309 | Tragic 77.0% |
| Comanche | 0.0 /100 | #310 | Tragic 77.0% |
| Blackfeet | 0.0 /100 | #311 | Tragic 77.0% |
| Alaskan Athabascans | 0.0 /100 | #312 | Tragic 76.9% |
| Shoshone | 0.0 /100 | #313 | Tragic 76.8% |
| Blacks/African Americans | 0.0 /100 | #314 | Tragic 76.8% |
| Ottawa | 0.0 /100 | #315 | Tragic 76.7% |
| Yaqui | 0.0 /100 | #316 | Tragic 76.5% |
| Cherokee | 0.0 /100 | #317 | Tragic 76.2% |
| Chickasaw | 0.0 /100 | #318 | Tragic 76.2% |