Immigrants from Czechoslovakia vs Lumbee In Labor Force | Age > 16
COMPARE
Immigrants from Czechoslovakia
Lumbee
In Labor Force | Age > 16
In Labor Force | Age > 16 Comparison
Immigrants from Czechoslovakia
Lumbee
64.8%
IN LABOR FORCE | AGE > 16
12.3/ 100
METRIC RATING
215th/ 347
METRIC RANK
56.8%
IN LABOR FORCE | AGE > 16
0.0/ 100
METRIC RATING
346th/ 347
METRIC RANK
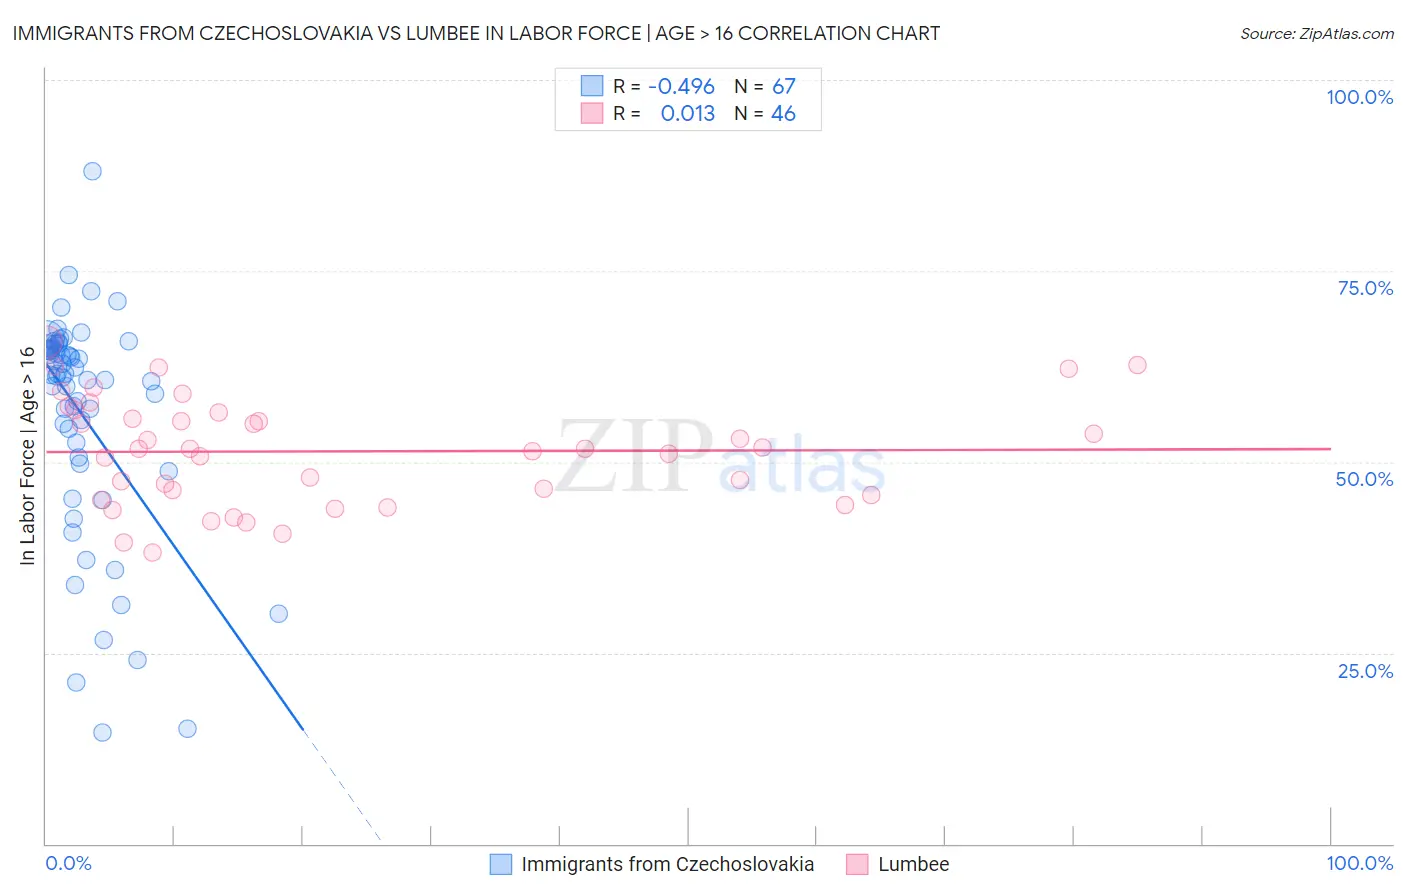
Immigrants from Czechoslovakia vs Lumbee In Labor Force | Age > 16 Correlation Chart
The statistical analysis conducted on geographies consisting of 195,457,762 people shows a moderate negative correlation between the proportion of Immigrants from Czechoslovakia and labor force participation rate among population ages 16 and over in the United States with a correlation coefficient (R) of -0.496 and weighted average of 64.8%. Similarly, the statistical analysis conducted on geographies consisting of 92,293,168 people shows no correlation between the proportion of Lumbee and labor force participation rate among population ages 16 and over in the United States with a correlation coefficient (R) of 0.013 and weighted average of 56.8%, a difference of 14.1%.
In Labor Force | Age > 16 Correlation Summary
| Measurement | Immigrants from Czechoslovakia | Lumbee |
| Minimum | 14.5% | 38.2% |
| Maximum | 88.1% | 65.7% |
| Range | 73.6% | 27.5% |
| Mean | 56.2% | 51.4% |
| Median | 61.4% | 51.7% |
| Interquartile 25% (IQ1) | 50.6% | 45.6% |
| Interquartile 75% (IQ3) | 64.9% | 56.4% |
| Interquartile Range (IQR) | 14.3% | 10.8% |
| Standard Deviation (Sample) | 14.7% | 7.0% |
| Standard Deviation (Population) | 14.6% | 6.9% |
Similar Demographics by In Labor Force | Age > 16
Demographics Similar to Immigrants from Czechoslovakia by In Labor Force | Age > 16
In terms of in labor force | age > 16, the demographic groups most similar to Immigrants from Czechoslovakia are Estonian (64.8%, a difference of 0.020%), Belgian (64.7%, a difference of 0.020%), U.S. Virgin Islander (64.7%, a difference of 0.030%), Alaskan Athabascan (64.8%, a difference of 0.040%), and Maltese (64.8%, a difference of 0.040%).
| Demographics | Rating | Rank | In Labor Force | Age > 16 |
| Belizeans | 16.2 /100 | #208 | Poor 64.8% |
| Immigrants | Trinidad and Tobago | 15.6 /100 | #209 | Poor 64.8% |
| Immigrants | Denmark | 14.7 /100 | #210 | Poor 64.8% |
| Fijians | 14.1 /100 | #211 | Poor 64.8% |
| Alaskan Athabascans | 13.9 /100 | #212 | Poor 64.8% |
| Maltese | 13.8 /100 | #213 | Poor 64.8% |
| Estonians | 13.1 /100 | #214 | Poor 64.8% |
| Immigrants | Czechoslovakia | 12.3 /100 | #215 | Poor 64.8% |
| Belgians | 11.4 /100 | #216 | Poor 64.7% |
| U.S. Virgin Islanders | 11.3 /100 | #217 | Poor 64.7% |
| Alsatians | 10.7 /100 | #218 | Poor 64.7% |
| Immigrants | Central America | 10.5 /100 | #219 | Poor 64.7% |
| Alaska Natives | 9.9 /100 | #220 | Tragic 64.7% |
| Immigrants | Micronesia | 9.6 /100 | #221 | Tragic 64.7% |
| Hawaiians | 9.3 /100 | #222 | Tragic 64.7% |
Demographics Similar to Lumbee by In Labor Force | Age > 16
In terms of in labor force | age > 16, the demographic groups most similar to Lumbee are Navajo (56.6%, a difference of 0.31%), Tohono O'odham (57.2%, a difference of 0.85%), Pima (57.4%, a difference of 1.1%), Yuman (57.8%, a difference of 1.8%), and Puerto Rican (58.1%, a difference of 2.4%).
| Demographics | Rating | Rank | In Labor Force | Age > 16 |
| Paiute | 0.0 /100 | #333 | Tragic 60.7% |
| Apache | 0.0 /100 | #334 | Tragic 60.7% |
| Natives/Alaskans | 0.0 /100 | #335 | Tragic 60.6% |
| Menominee | 0.0 /100 | #336 | Tragic 60.6% |
| Colville | 0.0 /100 | #337 | Tragic 59.8% |
| Immigrants | Yemen | 0.0 /100 | #338 | Tragic 59.6% |
| Houma | 0.0 /100 | #339 | Tragic 59.5% |
| Pueblo | 0.0 /100 | #340 | Tragic 59.3% |
| Hopi | 0.0 /100 | #341 | Tragic 58.4% |
| Puerto Ricans | 0.0 /100 | #342 | Tragic 58.1% |
| Yuman | 0.0 /100 | #343 | Tragic 57.8% |
| Pima | 0.0 /100 | #344 | Tragic 57.4% |
| Tohono O'odham | 0.0 /100 | #345 | Tragic 57.2% |
| Lumbee | 0.0 /100 | #346 | Tragic 56.8% |
| Navajo | 0.0 /100 | #347 | Tragic 56.6% |