Immigrants from Costa Rica vs Polish In Labor Force | Age > 16
COMPARE
Immigrants from Costa Rica
Polish
In Labor Force | Age > 16
In Labor Force | Age > 16 Comparison
Immigrants from Costa Rica
Poles
65.5%
IN LABOR FORCE | AGE > 16
90.8/ 100
METRIC RATING
140th/ 347
METRIC RANK
64.7%
IN LABOR FORCE | AGE > 16
8.3/ 100
METRIC RATING
227th/ 347
METRIC RANK
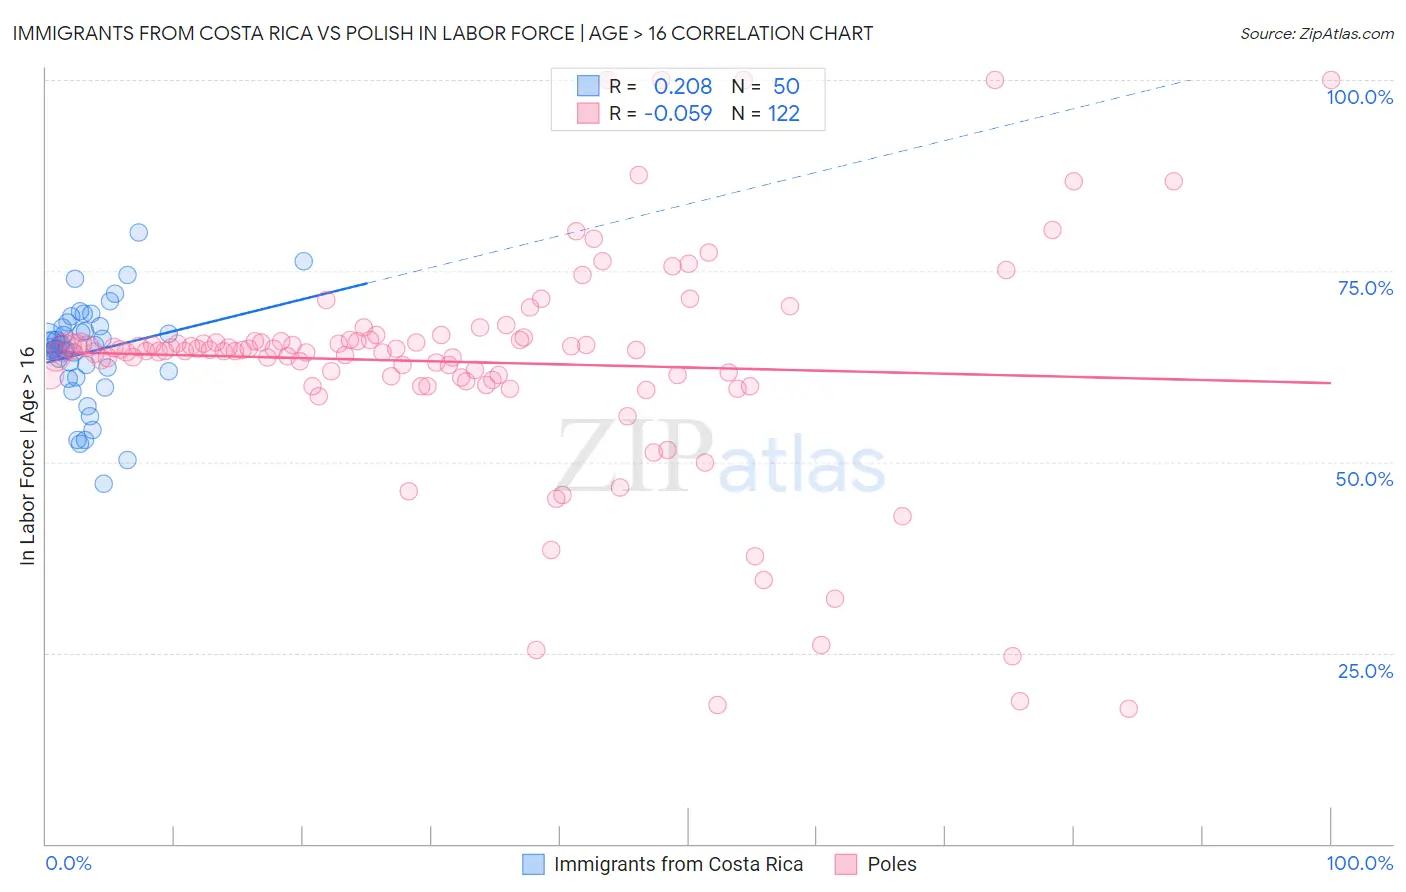
Immigrants from Costa Rica vs Polish In Labor Force | Age > 16 Correlation Chart
The statistical analysis conducted on geographies consisting of 204,275,671 people shows a weak positive correlation between the proportion of Immigrants from Costa Rica and labor force participation rate among population ages 16 and over in the United States with a correlation coefficient (R) of 0.208 and weighted average of 65.5%. Similarly, the statistical analysis conducted on geographies consisting of 560,604,274 people shows a slight negative correlation between the proportion of Poles and labor force participation rate among population ages 16 and over in the United States with a correlation coefficient (R) of -0.059 and weighted average of 64.7%, a difference of 1.3%.
In Labor Force | Age > 16 Correlation Summary
| Measurement | Immigrants from Costa Rica | Polish |
| Minimum | 47.1% | 17.6% |
| Maximum | 80.1% | 100.0% |
| Range | 33.0% | 82.4% |
| Mean | 64.3% | 63.1% |
| Median | 65.1% | 64.6% |
| Interquartile 25% (IQ1) | 61.9% | 61.1% |
| Interquartile 75% (IQ3) | 67.7% | 65.9% |
| Interquartile Range (IQR) | 5.8% | 4.9% |
| Standard Deviation (Sample) | 6.5% | 14.8% |
| Standard Deviation (Population) | 6.5% | 14.8% |
Similar Demographics by In Labor Force | Age > 16
Demographics Similar to Immigrants from Costa Rica by In Labor Force | Age > 16
In terms of in labor force | age > 16, the demographic groups most similar to Immigrants from Costa Rica are Immigrants from Taiwan (65.5%, a difference of 0.0%), Samoan (65.5%, a difference of 0.010%), Indian (Asian) (65.5%, a difference of 0.040%), Latvian (65.5%, a difference of 0.040%), and Immigrants from West Indies (65.6%, a difference of 0.050%).
| Demographics | Rating | Rank | In Labor Force | Age > 16 |
| Immigrants | Lithuania | 93.5 /100 | #133 | Exceptional 65.6% |
| Costa Ricans | 93.2 /100 | #134 | Exceptional 65.6% |
| Guatemalans | 92.5 /100 | #135 | Exceptional 65.6% |
| Immigrants | Argentina | 92.4 /100 | #136 | Exceptional 65.6% |
| Guamanians/Chamorros | 92.4 /100 | #137 | Exceptional 65.6% |
| Immigrants | West Indies | 92.0 /100 | #138 | Exceptional 65.6% |
| Immigrants | Taiwan | 90.8 /100 | #139 | Exceptional 65.5% |
| Immigrants | Costa Rica | 90.8 /100 | #140 | Exceptional 65.5% |
| Samoans | 90.5 /100 | #141 | Exceptional 65.5% |
| Indians (Asian) | 89.5 /100 | #142 | Excellent 65.5% |
| Latvians | 89.4 /100 | #143 | Excellent 65.5% |
| Immigrants | Romania | 88.6 /100 | #144 | Excellent 65.5% |
| Tlingit-Haida | 88.3 /100 | #145 | Excellent 65.5% |
| Cypriots | 88.2 /100 | #146 | Excellent 65.5% |
| Immigrants | Oceania | 87.5 /100 | #147 | Excellent 65.5% |
Demographics Similar to Poles by In Labor Force | Age > 16
In terms of in labor force | age > 16, the demographic groups most similar to Poles are European (64.7%, a difference of 0.0%), Northern European (64.7%, a difference of 0.0%), Immigrants from Jamaica (64.7%, a difference of 0.020%), Croatian (64.7%, a difference of 0.020%), and Immigrants from Belize (64.7%, a difference of 0.030%).
| Demographics | Rating | Rank | In Labor Force | Age > 16 |
| Alaska Natives | 9.9 /100 | #220 | Tragic 64.7% |
| Immigrants | Micronesia | 9.6 /100 | #221 | Tragic 64.7% |
| Hawaiians | 9.3 /100 | #222 | Tragic 64.7% |
| Immigrants | Belize | 9.2 /100 | #223 | Tragic 64.7% |
| Immigrants | Jamaica | 8.8 /100 | #224 | Tragic 64.7% |
| Croatians | 8.8 /100 | #225 | Tragic 64.7% |
| Europeans | 8.3 /100 | #226 | Tragic 64.7% |
| Poles | 8.3 /100 | #227 | Tragic 64.7% |
| Northern Europeans | 8.2 /100 | #228 | Tragic 64.7% |
| British | 7.3 /100 | #229 | Tragic 64.7% |
| Chinese | 7.3 /100 | #230 | Tragic 64.7% |
| Immigrants | Northern Europe | 7.2 /100 | #231 | Tragic 64.7% |
| Africans | 5.8 /100 | #232 | Tragic 64.6% |
| Slavs | 4.9 /100 | #233 | Tragic 64.6% |
| Vietnamese | 4.7 /100 | #234 | Tragic 64.6% |