Immigrants from Japan vs Polish In Labor Force | Age > 16
COMPARE
Immigrants from Japan
Polish
In Labor Force | Age > 16
In Labor Force | Age > 16 Comparison
Immigrants from Japan
Poles
65.8%
IN LABOR FORCE | AGE > 16
98.0/ 100
METRIC RATING
109th/ 347
METRIC RANK
64.7%
IN LABOR FORCE | AGE > 16
8.3/ 100
METRIC RATING
227th/ 347
METRIC RANK
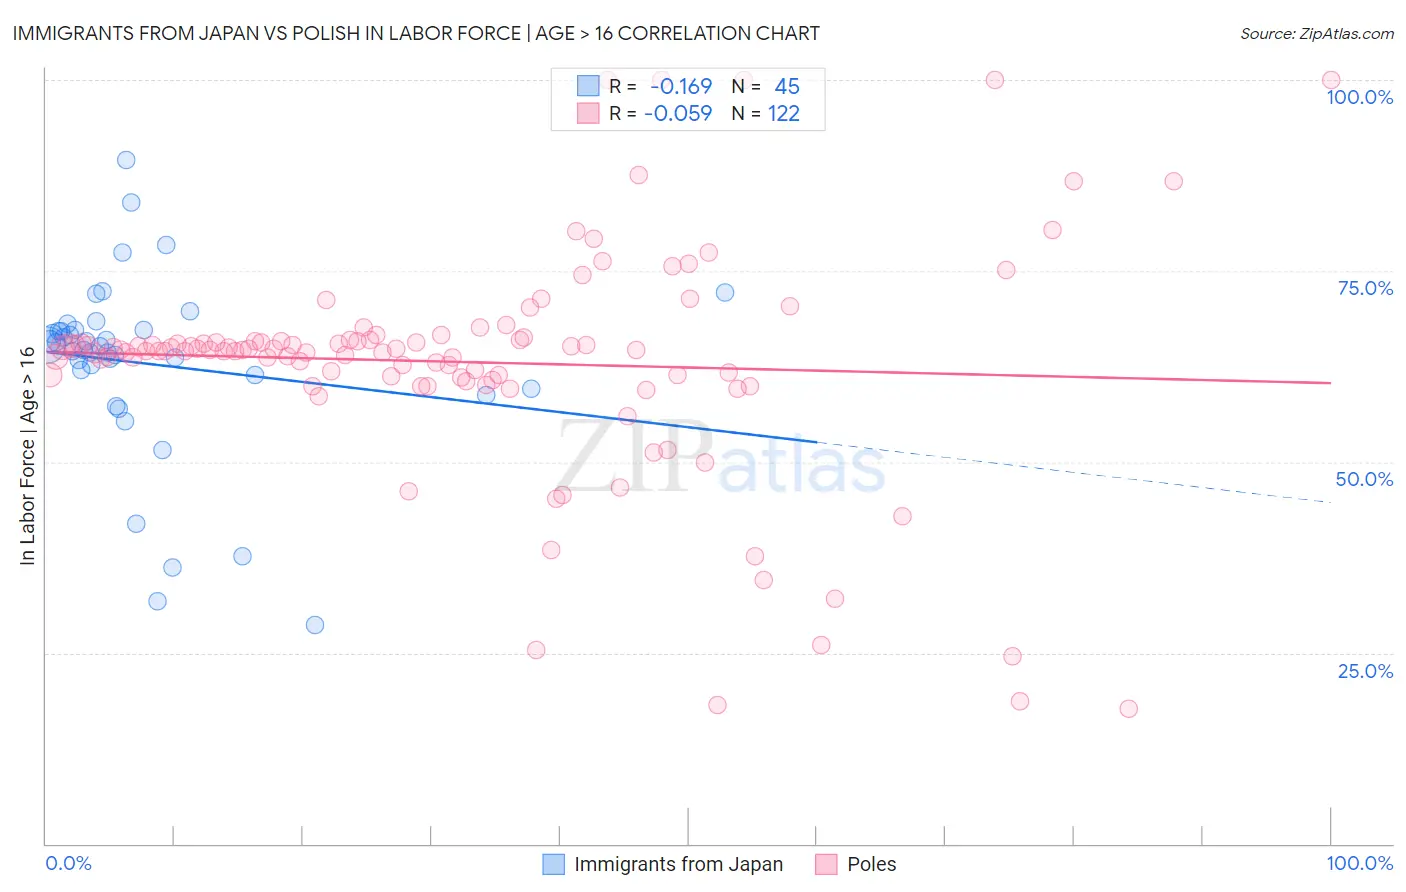
Immigrants from Japan vs Polish In Labor Force | Age > 16 Correlation Chart
The statistical analysis conducted on geographies consisting of 340,160,245 people shows a poor negative correlation between the proportion of Immigrants from Japan and labor force participation rate among population ages 16 and over in the United States with a correlation coefficient (R) of -0.169 and weighted average of 65.8%. Similarly, the statistical analysis conducted on geographies consisting of 560,604,274 people shows a slight negative correlation between the proportion of Poles and labor force participation rate among population ages 16 and over in the United States with a correlation coefficient (R) of -0.059 and weighted average of 64.7%, a difference of 1.8%.
In Labor Force | Age > 16 Correlation Summary
| Measurement | Immigrants from Japan | Polish |
| Minimum | 28.6% | 17.6% |
| Maximum | 89.6% | 100.0% |
| Range | 61.0% | 82.4% |
| Mean | 62.9% | 63.1% |
| Median | 65.1% | 64.6% |
| Interquartile 25% (IQ1) | 60.5% | 61.1% |
| Interquartile 75% (IQ3) | 67.3% | 65.9% |
| Interquartile Range (IQR) | 6.8% | 4.9% |
| Standard Deviation (Sample) | 12.0% | 14.8% |
| Standard Deviation (Population) | 11.9% | 14.8% |
Similar Demographics by In Labor Force | Age > 16
Demographics Similar to Immigrants from Japan by In Labor Force | Age > 16
In terms of in labor force | age > 16, the demographic groups most similar to Immigrants from Japan are Immigrants from Spain (65.8%, a difference of 0.0%), Immigrants from Serbia (65.8%, a difference of 0.020%), Immigrants from Poland (65.8%, a difference of 0.020%), Japanese (65.8%, a difference of 0.040%), and Colombian (65.9%, a difference of 0.060%).
| Demographics | Rating | Rank | In Labor Force | Age > 16 |
| Uruguayans | 98.6 /100 | #102 | Exceptional 65.9% |
| Immigrants | South Eastern Asia | 98.5 /100 | #103 | Exceptional 65.9% |
| Palestinians | 98.5 /100 | #104 | Exceptional 65.9% |
| Colombians | 98.4 /100 | #105 | Exceptional 65.9% |
| Immigrants | Serbia | 98.1 /100 | #106 | Exceptional 65.8% |
| Immigrants | Poland | 98.1 /100 | #107 | Exceptional 65.8% |
| Immigrants | Spain | 98.0 /100 | #108 | Exceptional 65.8% |
| Immigrants | Japan | 98.0 /100 | #109 | Exceptional 65.8% |
| Japanese | 97.7 /100 | #110 | Exceptional 65.8% |
| Immigrants | Honduras | 97.5 /100 | #111 | Exceptional 65.8% |
| Laotians | 97.4 /100 | #112 | Exceptional 65.8% |
| Pakistanis | 97.1 /100 | #113 | Exceptional 65.8% |
| Hondurans | 97.1 /100 | #114 | Exceptional 65.8% |
| Immigrants | Indonesia | 96.8 /100 | #115 | Exceptional 65.7% |
| Argentineans | 96.7 /100 | #116 | Exceptional 65.7% |
Demographics Similar to Poles by In Labor Force | Age > 16
In terms of in labor force | age > 16, the demographic groups most similar to Poles are European (64.7%, a difference of 0.0%), Northern European (64.7%, a difference of 0.0%), Immigrants from Jamaica (64.7%, a difference of 0.020%), Croatian (64.7%, a difference of 0.020%), and Immigrants from Belize (64.7%, a difference of 0.030%).
| Demographics | Rating | Rank | In Labor Force | Age > 16 |
| Alaska Natives | 9.9 /100 | #220 | Tragic 64.7% |
| Immigrants | Micronesia | 9.6 /100 | #221 | Tragic 64.7% |
| Hawaiians | 9.3 /100 | #222 | Tragic 64.7% |
| Immigrants | Belize | 9.2 /100 | #223 | Tragic 64.7% |
| Immigrants | Jamaica | 8.8 /100 | #224 | Tragic 64.7% |
| Croatians | 8.8 /100 | #225 | Tragic 64.7% |
| Europeans | 8.3 /100 | #226 | Tragic 64.7% |
| Poles | 8.3 /100 | #227 | Tragic 64.7% |
| Northern Europeans | 8.2 /100 | #228 | Tragic 64.7% |
| British | 7.3 /100 | #229 | Tragic 64.7% |
| Chinese | 7.3 /100 | #230 | Tragic 64.7% |
| Immigrants | Northern Europe | 7.2 /100 | #231 | Tragic 64.7% |
| Africans | 5.8 /100 | #232 | Tragic 64.6% |
| Slavs | 4.9 /100 | #233 | Tragic 64.6% |
| Vietnamese | 4.7 /100 | #234 | Tragic 64.6% |