Immigrants from Colombia vs Iranian In Labor Force | Age 35-44

COMPARE

Immigrants from Colombia
Race
Ancestry
AfghanAfricanAlaska NativeAlaskan AthabascanAlbanianAleutAlsatianAmericanApacheArabArapahoArgentineanArmenianAssyrian/Chaldean/SyriacAustralianAustrianBahamianBangladeshiBarbadianBasqueBelgianBelizeanBermudanBhutaneseBlackfeetBolivianBrazilianBritishBritish West IndianBulgarianBurmeseCajunCambodianCanadianCape VerdeanCarpatho RusynCelticCentral AmericanCentral American IndianCherokeeCheyenneChickasawChileanChineseChippewaChoctawColombianColvilleComancheCosta RicanCreeCreekCroatianCrowCubanCypriotCzechCzechoslovakianDanishDelawareDominicanDutchDutch West IndianEastern EuropeanEcuadorianEgyptianEnglishEstonianEthiopianEuropeanFijianFilipinoFinnishFrenchFrench American IndianFrench CanadianGermanGerman RussianGhanaianGreekGuamanian/ChamorroGuatemalanGuyaneseHaitianHmongHonduranHopiHoumaHungarianIcelanderIndian (Asian)IndonesianInupiatIraqiIrishIroquoisIsraeliItalianJamaicanJapaneseJordanianKenyanKiowaKoreanLaotianLatvianLebaneseLiberianLithuanianLumbeeLuxembourgerMacedonianMalaysianMalteseMarshalleseMenomineeMexicanMexican American IndianMongolianMoroccanNative HawaiianNavajoNepaleseNew ZealanderNicaraguanNigerianNorthern EuropeanNorwegianOkinawanOsageOttawaPaiutePakistaniPalestinianPanamanianParaguayanPennsylvania GermanPeruvianPimaPolishPortuguesePotawatomiPuebloPuerto RicanPuget Sound SalishRomanianRussianSalvadoranSamoanScandinavianScotch-IrishScottishSeminoleSenegaleseSerbianShoshoneSierra LeoneanSiouxSlavicSlovakSloveneSomaliSouth AfricanSouth AmericanSouth American IndianSoviet UnionSpaniardSpanishSpanish AmericanSpanish American IndianSri LankanSubsaharan AfricanSudaneseSwedishSwissSyrianTaiwaneseThaiTlingit-HaidaTohono O'OdhamTonganTrinidadian and TobagonianTsimshianTurkishU.S. Virgin IslanderUgandanUkrainianUruguayanUteVenezuelanVietnameseWelshWest IndianYakamaYaquiYugoslavianYumanYup'ikZimbabwean
Immigration
NonimmigrantsImmigrantsAfghanistanAfricaAlbaniaArgentinaArmeniaAsiaAustraliaAustriaBahamasBangladeshBarbadosBelarusBelgiumBelizeBoliviaBosnia and HerzegovinaBrazilBulgariaBurma/MyanmarCabo VerdeCambodiaCameroonCanadaCaribbeanCentral AmericaChileChinaColombiaCongoCosta RicaCroatiaCubaCzechoslovakiaDenmarkDominicaDominican RepublicEastern AfricaEastern AsiaEastern EuropeEcuadorEgyptEl SalvadorEnglandEritreaEthiopiaEuropeFijiFranceGermanyGhanaGreeceGrenadaGuatemalaGuyanaHaitiHondurasHong KongHungaryIndiaIndonesiaIranIraqIrelandIsraelItalyJamaicaJapanJordanKazakhstanKenyaKoreaKuwaitLaosLatin AmericaLatviaLebanonLiberiaLithuaniaMalaysiaMexicoMicronesiaMiddle AfricaMoldovaMoroccoNepalNetherlandsNicaraguaNigeriaNorth AmericaNorth MacedoniaNorthern AfricaNorthern EuropeNorwayOceaniaPakistanPanamaPeruPhilippinesPolandPortugalRomaniaRussiaSaudi ArabiaScotlandSenegalSerbiaSierra LeoneSingaporeSomaliaSouth AfricaSouth AmericaSouth Central AsiaSouth Eastern AsiaSouthern EuropeSpainSri LankaSt. Vincent and the GrenadinesSudanSwedenSwitzerlandSyriaTaiwanThailandTrinidad and TobagoTurkeyUgandaUkraineUruguayUzbekistanVenezuelaVietnamWest IndiesWestern AfricaWestern AsiaWestern EuropeYemenZaireZimbabweAzores
Iranian
Race
Ancestry
AfghanAfricanAlaska NativeAlaskan AthabascanAlbanianAleutAlsatianAmericanApacheArabArapahoArgentineanArmenianAssyrian/Chaldean/SyriacAustralianAustrianBahamianBangladeshiBarbadianBasqueBelgianBelizeanBermudanBhutaneseBlackfeetBolivianBrazilianBritishBritish West IndianBulgarianBurmeseCajunCambodianCanadianCape VerdeanCarpatho RusynCelticCentral AmericanCentral American IndianCherokeeCheyenneChickasawChileanChineseChippewaChoctawColombianColvilleComancheCosta RicanCreeCreekCroatianCrowCubanCypriotCzechCzechoslovakianDanishDelawareDominicanDutchDutch West IndianEastern EuropeanEcuadorianEgyptianEnglishEstonianEthiopianEuropeanFijianFilipinoFinnishFrenchFrench American IndianFrench CanadianGermanGerman RussianGhanaianGreekGuamanian/ChamorroGuatemalanGuyaneseHaitianHmongHonduranHopiHoumaHungarianIcelanderIndian (Asian)IndonesianInupiatIranianIraqiIrishIroquoisIsraeliItalianJamaicanJapaneseJordanianKenyanKiowaKoreanLaotianLatvianLebaneseLiberianLithuanianLumbeeLuxembourgerMacedonianMalaysianMalteseMarshalleseMenomineeMexicanMexican American IndianMongolianMoroccanNative HawaiianNavajoNepaleseNew ZealanderNicaraguanNigerianNorthern EuropeanNorwegianOkinawanOsageOttawaPaiutePakistaniPalestinianPanamanianParaguayanPennsylvania GermanPeruvianPimaPolishPortuguesePotawatomiPuebloPuerto RicanPuget Sound SalishRomanianRussianSalvadoranSamoanScandinavianScotch-IrishScottishSeminoleSenegaleseSerbianShoshoneSierra LeoneanSiouxSlavicSlovakSloveneSomaliSouth AfricanSouth AmericanSouth American IndianSoviet UnionSpaniardSpanishSpanish AmericanSpanish American IndianSri LankanSubsaharan AfricanSudaneseSwedishSwissSyrianTaiwaneseThaiTlingit-HaidaTohono O'OdhamTonganTrinidadian and TobagonianTsimshianTurkishU.S. Virgin IslanderUgandanUkrainianUruguayanUteVenezuelanVietnameseWelshWest IndianYakamaYaquiYugoslavianYumanYup'ikZimbabwean
Immigration
NonimmigrantsImmigrantsAfghanistanAfricaAlbaniaArgentinaArmeniaAsiaAustraliaAustriaBahamasBangladeshBarbadosBelarusBelgiumBelizeBoliviaBosnia and HerzegovinaBrazilBulgariaBurma/MyanmarCabo VerdeCambodiaCameroonCanadaCaribbeanCentral AmericaChileChinaCongoCosta RicaCroatiaCubaCzechoslovakiaDenmarkDominicaDominican RepublicEastern AfricaEastern AsiaEastern EuropeEcuadorEgyptEl SalvadorEnglandEritreaEthiopiaEuropeFijiFranceGermanyGhanaGreeceGrenadaGuatemalaGuyanaHaitiHondurasHong KongHungaryIndiaIndonesiaIranIraqIrelandIsraelItalyJamaicaJapanJordanKazakhstanKenyaKoreaKuwaitLaosLatin AmericaLatviaLebanonLiberiaLithuaniaMalaysiaMexicoMicronesiaMiddle AfricaMoldovaMoroccoNepalNetherlandsNicaraguaNigeriaNorth AmericaNorth MacedoniaNorthern AfricaNorthern EuropeNorwayOceaniaPakistanPanamaPeruPhilippinesPolandPortugalRomaniaRussiaSaudi ArabiaScotlandSenegalSerbiaSierra LeoneSingaporeSomaliaSouth AfricaSouth AmericaSouth Central AsiaSouth Eastern AsiaSouthern EuropeSpainSri LankaSt. Vincent and the GrenadinesSudanSwedenSwitzerlandSyriaTaiwanThailandTrinidad and TobagoTurkeyUgandaUkraineUruguayUzbekistanVenezuelaVietnamWest IndiesWestern AfricaWestern AsiaWestern EuropeYemenZaireZimbabweAzores
In Labor Force | Age 35-44
Income
Poverty
Unemployment
Labor Participation
Family Structure
Vehicle Availability
Education Level
Disability

In Labor Force | Age 35-44 Comparison

Immigrants from Colombia

Iranians

Exceptional
Good
84.9%
IN LABOR FORCE | AGE 35-44
98.3/ 100
METRIC RATING
80th/ 347
METRIC RANK
84.5%
IN LABOR FORCE | AGE 35-44
69.4/ 100
METRIC RATING
154th/ 347
METRIC RANK

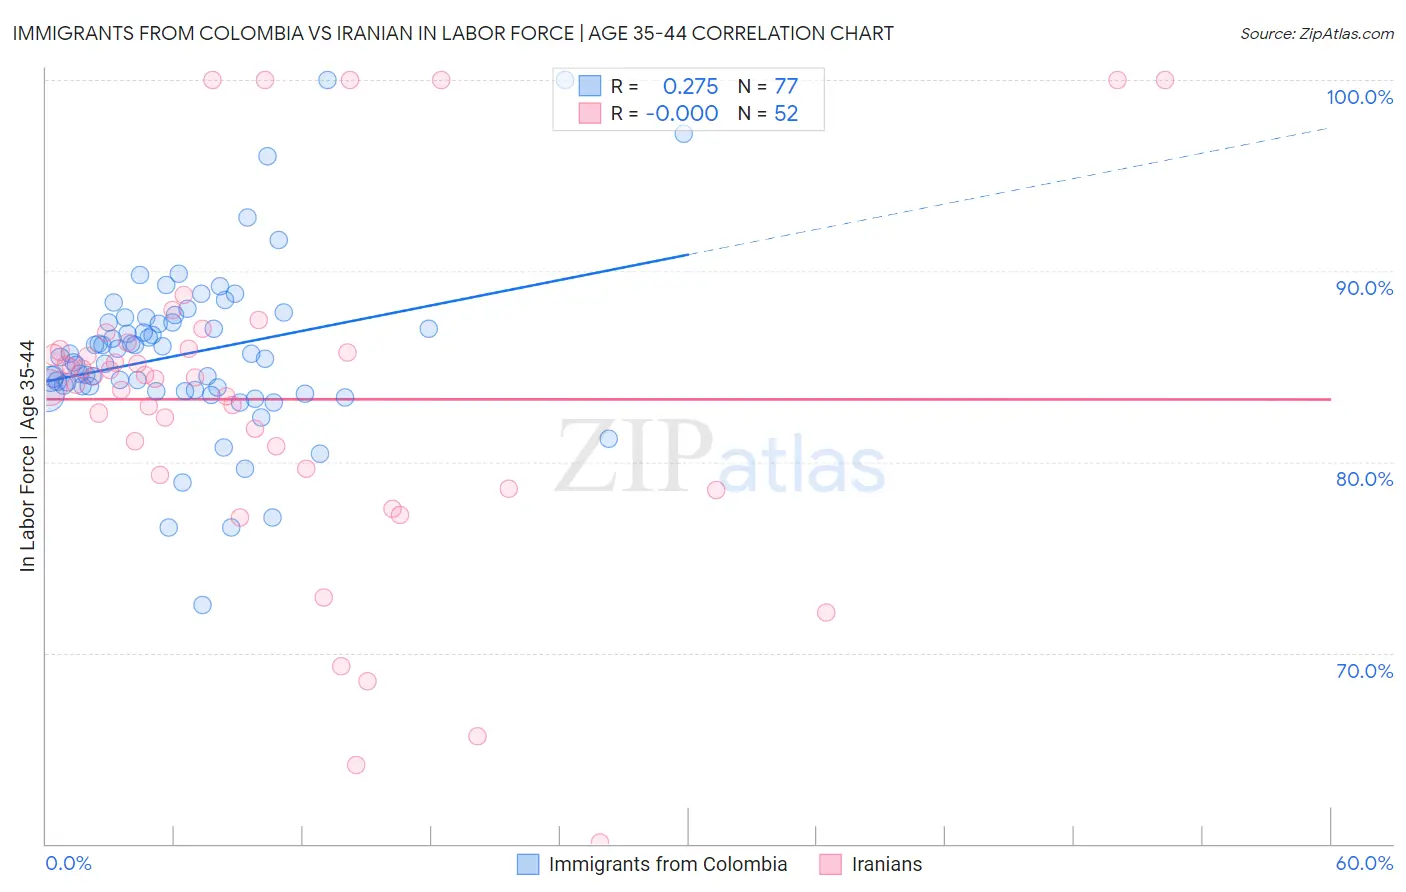
Immigrants from Colombia vs Iranian In Labor Force | Age 35-44 Correlation Chart

The statistical analysis conducted on geographies consisting of 378,571,639 people shows a weak positive correlation between the proportion of Immigrants from Colombia and labor force participation rate among population between the ages 35 and 44 in the United States with a correlation coefficient (R) of 0.275 and weighted average of 84.9%. Similarly, the statistical analysis conducted on geographies consisting of 316,731,411 people shows no correlation between the proportion of Iranians and labor force participation rate among population between the ages 35 and 44 in the United States with a correlation coefficient (R) of -0.000 and weighted average of 84.5%, a difference of 0.52%.
Immigrants from Colombia vs Iranian In Labor Force | Age 35-44

In Labor Force | Age 35-44 Correlation Summary

MeasurementImmigrants from ColombiaIranian
Minimum72.5%60.0%
Maximum100.0%100.0%
Range27.5%40.0%
Mean85.7%83.3%
Median85.5%84.4%
Interquartile 25% (IQ1)83.8%79.5%
Interquartile 75% (IQ3)87.4%85.9%
Interquartile Range (IQR)3.7%6.4%
Standard Deviation (Sample)4.5%8.7%
Standard Deviation (Population)4.4%8.7%

Similar Demographics by In Labor Force | Age 35-44

Demographics Similar to Immigrants from Colombia by In Labor Force | Age 35-44

In terms of in labor force | age 35-44, the demographic groups most similar to Immigrants from Colombia are Peruvian (84.9%, a difference of 0.0%), Immigrants from Eastern Europe (84.9%, a difference of 0.0%), Immigrants from Africa (84.9%, a difference of 0.010%), Immigrants from Sudan (84.9%, a difference of 0.020%), and Immigrants from Cuba (84.9%, a difference of 0.030%).
DemographicsRating | RankIn Labor Force | Age 35-44
Immigrants | Sri Lanka
98.9
/100
|
#73
Exceptional
85.0%
Colombians
98.8
/100
|
#74
Exceptional
85.0%
Immigrants | South Central Asia
98.7
/100
|
#75
Exceptional
85.0%
Immigrants | Cuba
98.6
/100
|
#76
Exceptional
84.9%
Immigrants | Turkey
98.6
/100
|
#77
Exceptional
84.9%
Immigrants | Africa
98.4
/100
|
#78
Exceptional
84.9%
Peruvians
98.3
/100
|
#79
Exceptional
84.9%
Immigrants | Colombia
98.3
/100
|
#80
Exceptional
84.9%
Immigrants | Eastern Europe
98.3
/100
|
#81
Exceptional
84.9%
Immigrants | Sudan
98.1
/100
|
#82
Exceptional
84.9%
Senegalese
97.8
/100
|
#83
Exceptional
84.9%
Immigrants | Peru
97.8
/100
|
#84
Exceptional
84.9%
Immigrants | Middle Africa
97.8
/100
|
#85
Exceptional
84.9%
Greeks
97.8
/100
|
#86
Exceptional
84.9%
Belgians
97.7
/100
|
#87
Exceptional
84.9%

Demographics Similar to Iranians by In Labor Force | Age 35-44

In terms of in labor force | age 35-44, the demographic groups most similar to Iranians are Trinidadian and Tobagonian (84.5%, a difference of 0.0%), Romanian (84.5%, a difference of 0.020%), Immigrants from Taiwan (84.5%, a difference of 0.020%), South American Indian (84.5%, a difference of 0.030%), and Okinawan (84.5%, a difference of 0.030%).
DemographicsRating | RankIn Labor Force | Age 35-44
Immigrants | Netherlands
76.6
/100
|
#147
Good
84.5%
South American Indians
73.6
/100
|
#148
Good
84.5%
Okinawans
73.5
/100
|
#149
Good
84.5%
Immigrants | Nigeria
73.3
/100
|
#150
Good
84.5%
Romanians
72.1
/100
|
#151
Good
84.5%
Immigrants | Taiwan
71.4
/100
|
#152
Good
84.5%
Trinidadians and Tobagonians
69.5
/100
|
#153
Good
84.5%
Iranians
69.4
/100
|
#154
Good
84.5%
Immigrants | Switzerland
65.9
/100
|
#155
Good
84.5%
Immigrants | Israel
64.3
/100
|
#156
Good
84.4%
Immigrants | Austria
63.8
/100
|
#157
Good
84.4%
Jamaicans
62.7
/100
|
#158
Good
84.4%
Immigrants | Senegal
60.4
/100
|
#159
Good
84.4%
Immigrants | Kazakhstan
60.4
/100
|
#160
Good
84.4%
Immigrants | Venezuela
60.0
/100
|
#161
Good
84.4%