Immigrants from India vs Uruguayan In Labor Force | Age 35-44
COMPARE
Immigrants from India
Uruguayan
In Labor Force | Age 35-44
In Labor Force | Age 35-44 Comparison
Immigrants from India
Uruguayans
85.3%
IN LABOR FORCE | AGE 35-44
99.9/ 100
METRIC RATING
32nd/ 347
METRIC RANK
84.7%
IN LABOR FORCE | AGE 35-44
93.3/ 100
METRIC RATING
113th/ 347
METRIC RANK
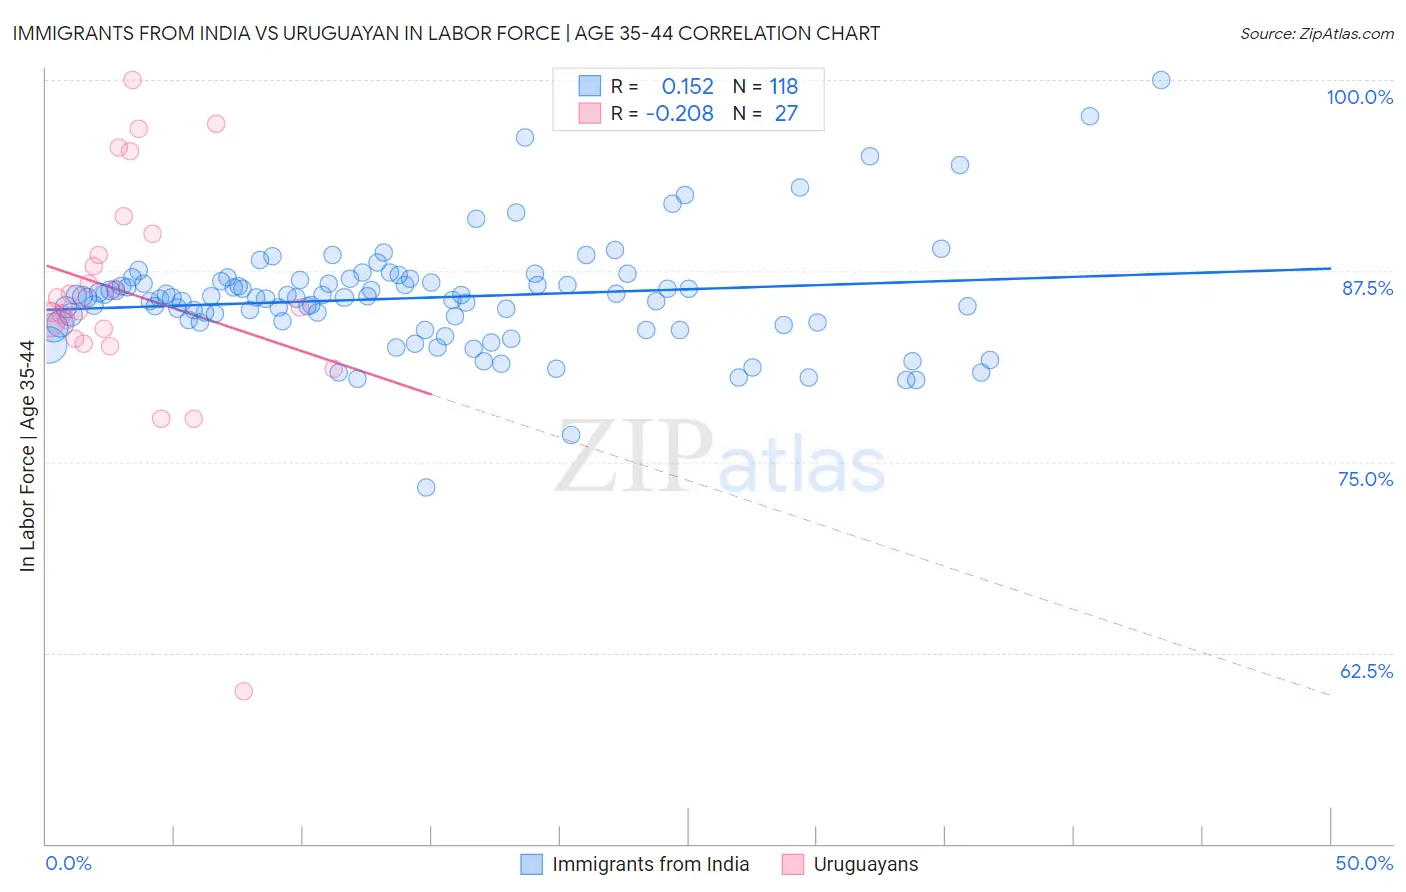
Immigrants from India vs Uruguayan In Labor Force | Age 35-44 Correlation Chart
The statistical analysis conducted on geographies consisting of 433,829,652 people shows a poor positive correlation between the proportion of Immigrants from India and labor force participation rate among population between the ages 35 and 44 in the United States with a correlation coefficient (R) of 0.152 and weighted average of 85.3%. Similarly, the statistical analysis conducted on geographies consisting of 144,759,771 people shows a weak negative correlation between the proportion of Uruguayans and labor force participation rate among population between the ages 35 and 44 in the United States with a correlation coefficient (R) of -0.208 and weighted average of 84.7%, a difference of 0.68%.
In Labor Force | Age 35-44 Correlation Summary
| Measurement | Immigrants from India | Uruguayan |
| Minimum | 73.3% | 60.0% |
| Maximum | 100.0% | 100.0% |
| Range | 26.7% | 40.0% |
| Mean | 85.7% | 86.1% |
| Median | 85.8% | 85.1% |
| Interquartile 25% (IQ1) | 84.1% | 83.0% |
| Interquartile 75% (IQ3) | 86.8% | 90.0% |
| Interquartile Range (IQR) | 2.7% | 7.0% |
| Standard Deviation (Sample) | 3.6% | 7.7% |
| Standard Deviation (Population) | 3.6% | 7.6% |
Similar Demographics by In Labor Force | Age 35-44
Demographics Similar to Immigrants from India by In Labor Force | Age 35-44
In terms of in labor force | age 35-44, the demographic groups most similar to Immigrants from India are Bermudan (85.3%, a difference of 0.0%), Czech (85.3%, a difference of 0.0%), Ugandan (85.3%, a difference of 0.010%), Cambodian (85.3%, a difference of 0.020%), and Immigrants from Nepal (85.3%, a difference of 0.030%).
| Demographics | Rating | Rank | In Labor Force | Age 35-44 |
| Paraguayans | 99.9 /100 | #25 | Exceptional 85.4% |
| Immigrants | Liberia | 99.9 /100 | #26 | Exceptional 85.4% |
| Immigrants | Lithuania | 99.9 /100 | #27 | Exceptional 85.4% |
| Immigrants | Greece | 99.9 /100 | #28 | Exceptional 85.3% |
| Cambodians | 99.9 /100 | #29 | Exceptional 85.3% |
| Bermudans | 99.9 /100 | #30 | Exceptional 85.3% |
| Czechs | 99.9 /100 | #31 | Exceptional 85.3% |
| Immigrants | India | 99.9 /100 | #32 | Exceptional 85.3% |
| Ugandans | 99.9 /100 | #33 | Exceptional 85.3% |
| Immigrants | Nepal | 99.9 /100 | #34 | Exceptional 85.3% |
| Estonians | 99.9 /100 | #35 | Exceptional 85.3% |
| Immigrants | Morocco | 99.8 /100 | #36 | Exceptional 85.2% |
| Kenyans | 99.8 /100 | #37 | Exceptional 85.2% |
| Immigrants | Poland | 99.8 /100 | #38 | Exceptional 85.2% |
| Eastern Europeans | 99.8 /100 | #39 | Exceptional 85.2% |
Demographics Similar to Uruguayans by In Labor Force | Age 35-44
In terms of in labor force | age 35-44, the demographic groups most similar to Uruguayans are Immigrants from Western Africa (84.7%, a difference of 0.0%), Chilean (84.7%, a difference of 0.0%), Bahamian (84.7%, a difference of 0.0%), Filipino (84.7%, a difference of 0.010%), and Ukrainian (84.7%, a difference of 0.010%).
| Demographics | Rating | Rank | In Labor Force | Age 35-44 |
| Immigrants | Bahamas | 94.8 /100 | #106 | Exceptional 84.8% |
| Immigrants | Romania | 94.7 /100 | #107 | Exceptional 84.8% |
| Immigrants | Argentina | 94.5 /100 | #108 | Exceptional 84.8% |
| Immigrants | Russia | 94.5 /100 | #109 | Exceptional 84.8% |
| Filipinos | 93.8 /100 | #110 | Exceptional 84.7% |
| Ukrainians | 93.5 /100 | #111 | Exceptional 84.7% |
| Immigrants | Western Africa | 93.4 /100 | #112 | Exceptional 84.7% |
| Uruguayans | 93.3 /100 | #113 | Exceptional 84.7% |
| Chileans | 93.2 /100 | #114 | Exceptional 84.7% |
| Bahamians | 93.2 /100 | #115 | Exceptional 84.7% |
| Immigrants | Egypt | 92.7 /100 | #116 | Exceptional 84.7% |
| Immigrants | China | 92.3 /100 | #117 | Exceptional 84.7% |
| Immigrants | Eastern Asia | 92.1 /100 | #118 | Exceptional 84.7% |
| Burmese | 91.8 /100 | #119 | Exceptional 84.7% |
| Immigrants | Northern Europe | 91.5 /100 | #120 | Exceptional 84.7% |