Immigrants from China vs British Disability Age Over 75
COMPARE
Immigrants from China
British
Disability Age Over 75
Disability Age Over 75 Comparison
Immigrants from China
British
46.3%
DISABILITY AGE OVER 75
98.0/ 100
METRIC RATING
96th/ 347
METRIC RANK
46.5%
DISABILITY AGE OVER 75
95.7/ 100
METRIC RATING
115th/ 347
METRIC RANK
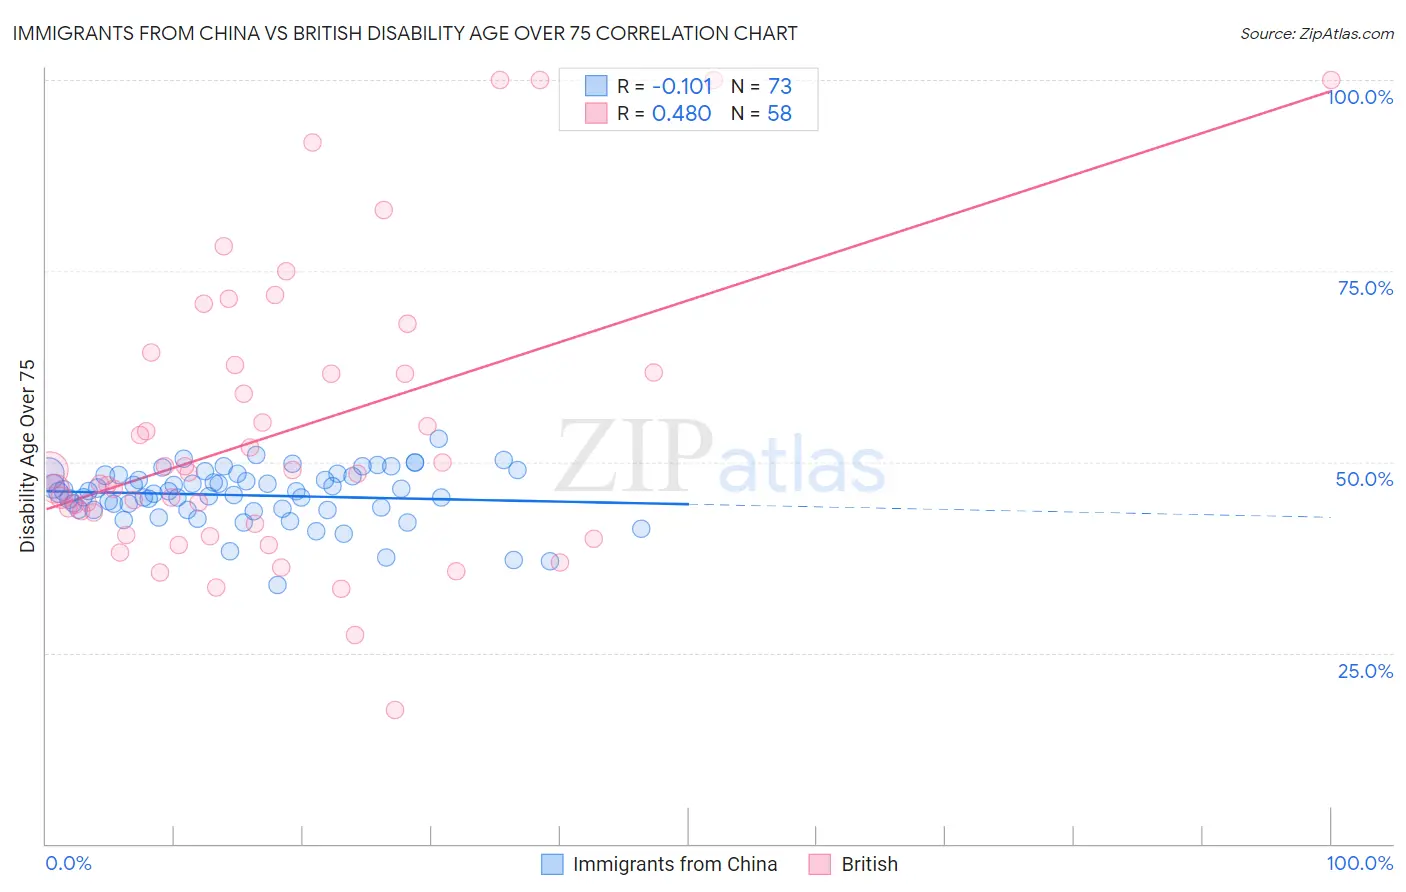
Immigrants from China vs British Disability Age Over 75 Correlation Chart
The statistical analysis conducted on geographies consisting of 455,855,137 people shows a poor negative correlation between the proportion of Immigrants from China and percentage of population with a disability over the age of 75 in the United States with a correlation coefficient (R) of -0.101 and weighted average of 46.3%. Similarly, the statistical analysis conducted on geographies consisting of 529,995,631 people shows a moderate positive correlation between the proportion of British and percentage of population with a disability over the age of 75 in the United States with a correlation coefficient (R) of 0.480 and weighted average of 46.5%, a difference of 0.44%.
Disability Age Over 75 Correlation Summary
| Measurement | Immigrants from China | British |
| Minimum | 33.8% | 17.6% |
| Maximum | 53.1% | 100.0% |
| Range | 19.3% | 82.4% |
| Mean | 45.6% | 53.7% |
| Median | 46.2% | 48.5% |
| Interquartile 25% (IQ1) | 43.8% | 41.9% |
| Interquartile 75% (IQ3) | 48.3% | 61.8% |
| Interquartile Range (IQR) | 4.5% | 19.9% |
| Standard Deviation (Sample) | 3.6% | 18.7% |
| Standard Deviation (Population) | 3.5% | 18.6% |
Demographics Similar to Immigrants from China and British by Disability Age Over 75
In terms of disability age over 75, the demographic groups most similar to Immigrants from China are Immigrants from Brazil (46.3%, a difference of 0.010%), Finnish (46.3%, a difference of 0.020%), Immigrants from Japan (46.3%, a difference of 0.030%), Palestinian (46.3%, a difference of 0.070%), and Immigrants from Eastern Europe (46.3%, a difference of 0.080%). Similarly, the demographic groups most similar to British are Dutch (46.5%, a difference of 0.020%), Irish (46.5%, a difference of 0.040%), Immigrants from Pakistan (46.5%, a difference of 0.050%), Immigrants from Hong Kong (46.5%, a difference of 0.10%), and Immigrants from Chile (46.5%, a difference of 0.10%).
| Demographics | Rating | Rank | Disability Age Over 75 |
| Immigrants | Brazil | 98.0 /100 | #95 | Exceptional 46.3% |
| Immigrants | China | 98.0 /100 | #96 | Exceptional 46.3% |
| Finns | 97.9 /100 | #97 | Exceptional 46.3% |
| Immigrants | Japan | 97.8 /100 | #98 | Exceptional 46.3% |
| Palestinians | 97.7 /100 | #99 | Exceptional 46.3% |
| Immigrants | Eastern Europe | 97.7 /100 | #100 | Exceptional 46.3% |
| Mongolians | 97.7 /100 | #101 | Exceptional 46.3% |
| Immigrants | Malaysia | 97.1 /100 | #102 | Exceptional 46.4% |
| Ukrainians | 97.1 /100 | #103 | Exceptional 46.4% |
| Israelis | 97.0 /100 | #104 | Exceptional 46.4% |
| Immigrants | Cameroon | 96.9 /100 | #105 | Exceptional 46.4% |
| Immigrants | Kuwait | 96.8 /100 | #106 | Exceptional 46.4% |
| Immigrants | Uruguay | 96.7 /100 | #107 | Exceptional 46.4% |
| Brazilians | 96.6 /100 | #108 | Exceptional 46.5% |
| Chileans | 96.4 /100 | #109 | Exceptional 46.5% |
| Immigrants | Hong Kong | 96.4 /100 | #110 | Exceptional 46.5% |
| Immigrants | Chile | 96.4 /100 | #111 | Exceptional 46.5% |
| Immigrants | Pakistan | 96.1 /100 | #112 | Exceptional 46.5% |
| Irish | 96.0 /100 | #113 | Exceptional 46.5% |
| Dutch | 95.9 /100 | #114 | Exceptional 46.5% |
| British | 95.7 /100 | #115 | Exceptional 46.5% |