Immigrants from Central America vs Native/Alaskan In Labor Force | Age 25-29
COMPARE
Immigrants from Central America
Native/Alaskan
In Labor Force | Age 25-29
In Labor Force | Age 25-29 Comparison
Immigrants from Central America
Natives/Alaskans
82.4%
IN LABOR FORCE | AGE 25-29
0.0/ 100
METRIC RATING
309th/ 347
METRIC RANK
79.3%
IN LABOR FORCE | AGE 25-29
0.0/ 100
METRIC RATING
335th/ 347
METRIC RANK
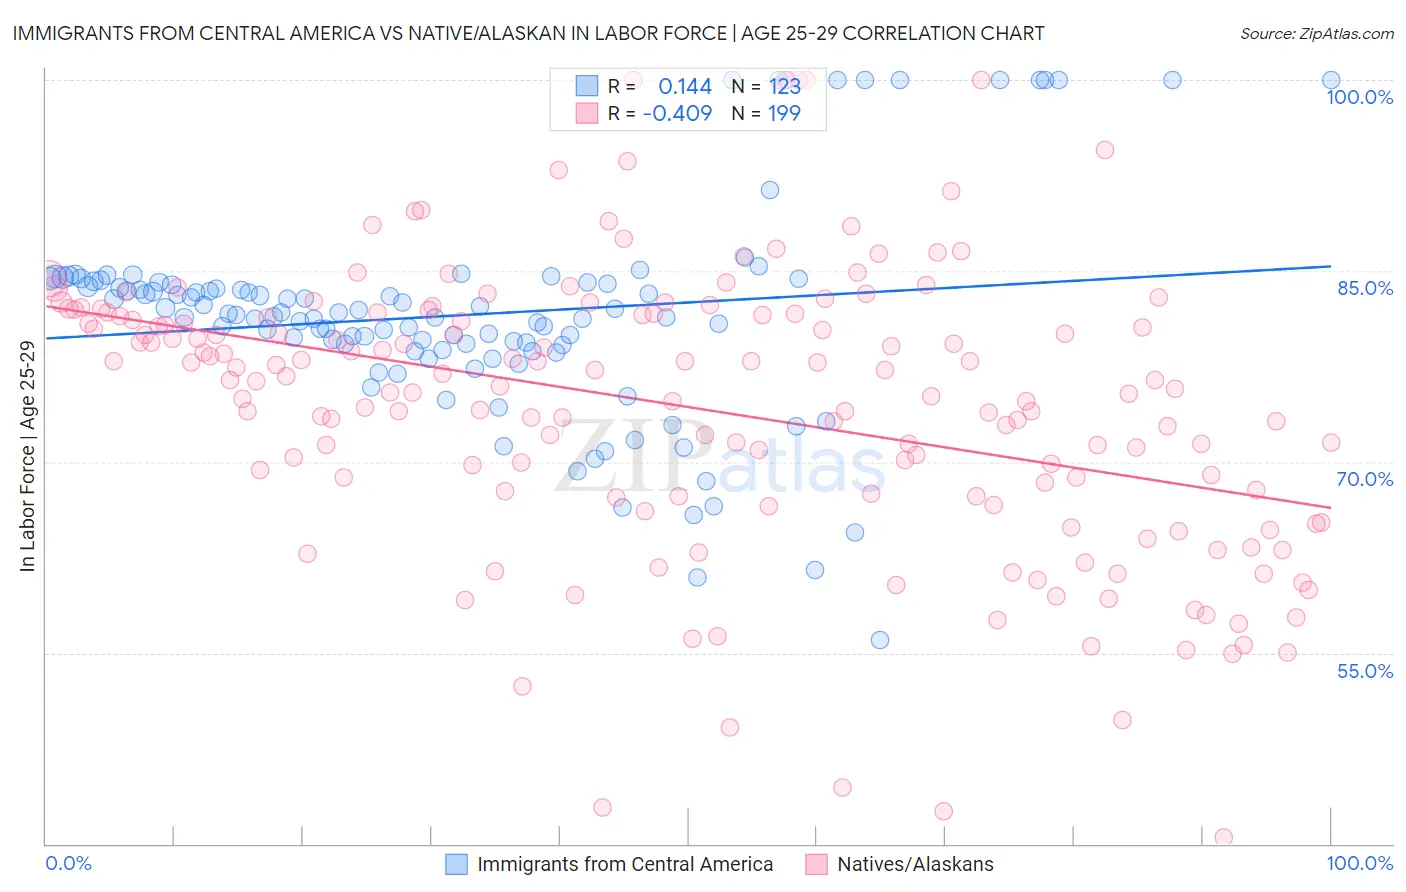
Immigrants from Central America vs Native/Alaskan In Labor Force | Age 25-29 Correlation Chart
The statistical analysis conducted on geographies consisting of 535,870,907 people shows a poor positive correlation between the proportion of Immigrants from Central America and labor force participation rate among population between the ages 25 and 29 in the United States with a correlation coefficient (R) of 0.144 and weighted average of 82.4%. Similarly, the statistical analysis conducted on geographies consisting of 512,496,392 people shows a moderate negative correlation between the proportion of Natives/Alaskans and labor force participation rate among population between the ages 25 and 29 in the United States with a correlation coefficient (R) of -0.409 and weighted average of 79.3%, a difference of 4.0%.
In Labor Force | Age 25-29 Correlation Summary
| Measurement | Immigrants from Central America | Native/Alaskan |
| Minimum | 56.0% | 40.5% |
| Maximum | 100.0% | 100.0% |
| Range | 44.0% | 59.5% |
| Mean | 81.5% | 74.3% |
| Median | 81.6% | 76.3% |
| Interquartile 25% (IQ1) | 78.8% | 67.3% |
| Interquartile 75% (IQ3) | 84.1% | 81.6% |
| Interquartile Range (IQR) | 5.3% | 14.3% |
| Standard Deviation (Sample) | 8.3% | 11.3% |
| Standard Deviation (Population) | 8.2% | 11.2% |
Similar Demographics by In Labor Force | Age 25-29
Demographics Similar to Immigrants from Central America by In Labor Force | Age 25-29
In terms of in labor force | age 25-29, the demographic groups most similar to Immigrants from Central America are Central American Indian (82.4%, a difference of 0.010%), Osage (82.3%, a difference of 0.14%), Alaskan Athabascan (82.3%, a difference of 0.15%), Cajun (82.5%, a difference of 0.16%), and Hispanic or Latino (82.2%, a difference of 0.21%).
| Demographics | Rating | Rank | In Labor Force | Age 25-29 |
| Immigrants | Belize | 0.0 /100 | #302 | Tragic 82.8% |
| Immigrants | Grenada | 0.0 /100 | #303 | Tragic 82.8% |
| Immigrants | St. Vincent and the Grenadines | 0.0 /100 | #304 | Tragic 82.7% |
| Blacks/African Americans | 0.0 /100 | #305 | Tragic 82.6% |
| Blackfeet | 0.0 /100 | #306 | Tragic 82.6% |
| Cajuns | 0.0 /100 | #307 | Tragic 82.5% |
| Central American Indians | 0.0 /100 | #308 | Tragic 82.4% |
| Immigrants | Central America | 0.0 /100 | #309 | Tragic 82.4% |
| Osage | 0.0 /100 | #310 | Tragic 82.3% |
| Alaskan Athabascans | 0.0 /100 | #311 | Tragic 82.3% |
| Hispanics or Latinos | 0.0 /100 | #312 | Tragic 82.2% |
| Yaqui | 0.0 /100 | #313 | Tragic 82.2% |
| Cherokee | 0.0 /100 | #314 | Tragic 82.1% |
| Immigrants | Mexico | 0.0 /100 | #315 | Tragic 82.0% |
| Mexicans | 0.0 /100 | #316 | Tragic 81.9% |
Demographics Similar to Natives/Alaskans by In Labor Force | Age 25-29
In terms of in labor force | age 25-29, the demographic groups most similar to Natives/Alaskans are Apache (79.2%, a difference of 0.070%), Yuman (79.3%, a difference of 0.080%), Sioux (79.7%, a difference of 0.50%), Inupiat (79.8%, a difference of 0.61%), and Crow (78.6%, a difference of 0.83%).
| Demographics | Rating | Rank | In Labor Force | Age 25-29 |
| Creek | 0.0 /100 | #328 | Tragic 80.7% |
| Yakama | 0.0 /100 | #329 | Tragic 80.6% |
| Puerto Ricans | 0.0 /100 | #330 | Tragic 80.4% |
| Cheyenne | 0.0 /100 | #331 | Tragic 80.3% |
| Inupiat | 0.0 /100 | #332 | Tragic 79.8% |
| Sioux | 0.0 /100 | #333 | Tragic 79.7% |
| Yuman | 0.0 /100 | #334 | Tragic 79.3% |
| Natives/Alaskans | 0.0 /100 | #335 | Tragic 79.3% |
| Apache | 0.0 /100 | #336 | Tragic 79.2% |
| Crow | 0.0 /100 | #337 | Tragic 78.6% |
| Lumbee | 0.0 /100 | #338 | Tragic 78.3% |
| Immigrants | Yemen | 0.0 /100 | #339 | Tragic 78.2% |
| Paiute | 0.0 /100 | #340 | Tragic 78.1% |
| Tohono O'odham | 0.0 /100 | #341 | Tragic 77.5% |
| Pueblo | 0.0 /100 | #342 | Tragic 77.5% |