Immigrants from Central America vs Somali Professional Degree
COMPARE
Immigrants from Central America
Somali
Professional Degree
Professional Degree Comparison
Immigrants from Central America
Somalis
2.9%
PROFESSIONAL DEGREE
0.0/ 100
METRIC RATING
339th/ 347
METRIC RANK
4.1%
PROFESSIONAL DEGREE
14.8/ 100
METRIC RATING
205th/ 347
METRIC RANK
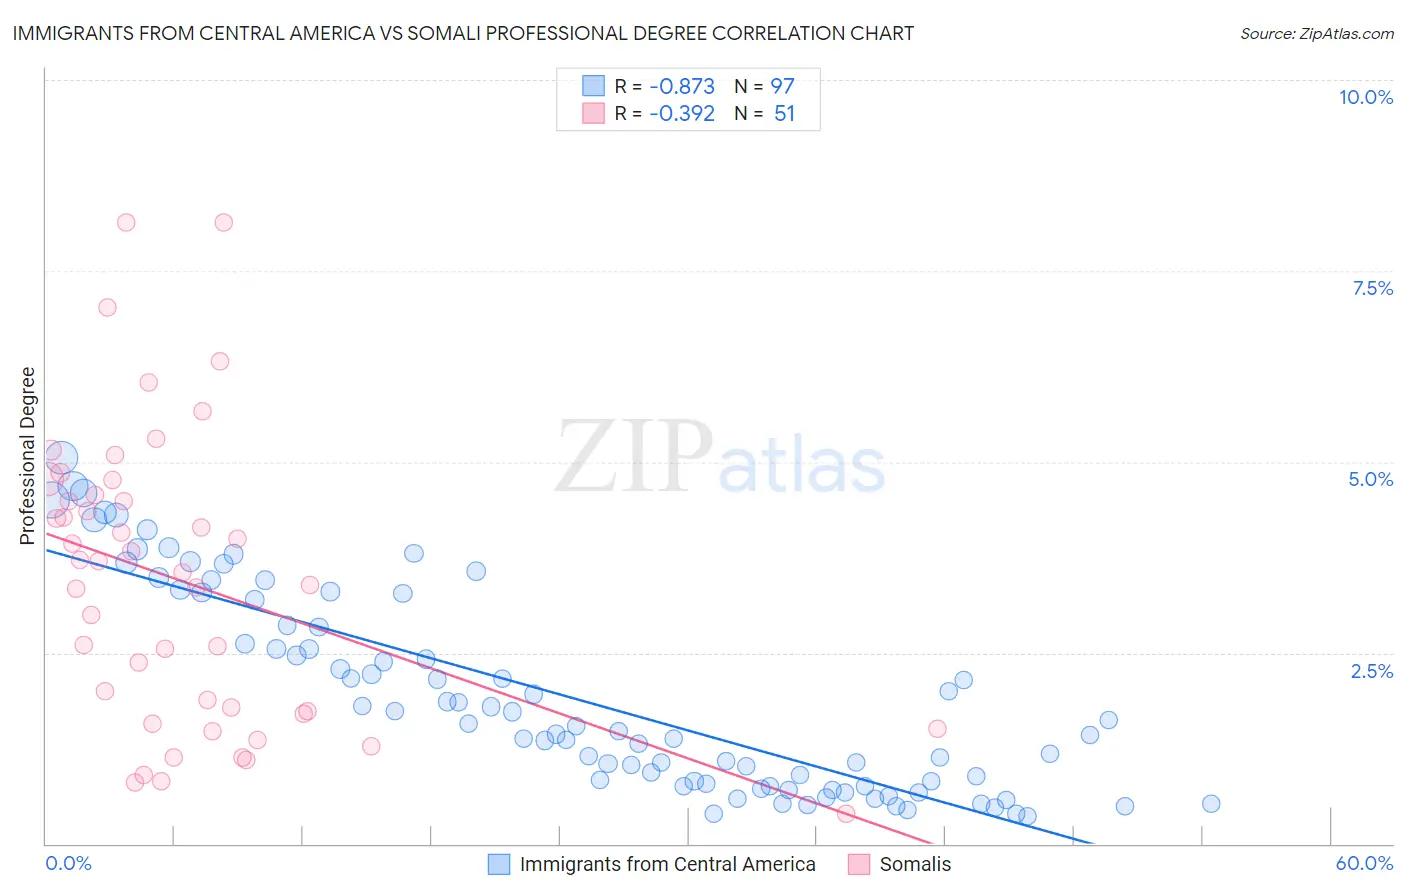
Immigrants from Central America vs Somali Professional Degree Correlation Chart
The statistical analysis conducted on geographies consisting of 530,794,106 people shows a very strong negative correlation between the proportion of Immigrants from Central America and percentage of population with at least professional degree education in the United States with a correlation coefficient (R) of -0.873 and weighted average of 2.9%. Similarly, the statistical analysis conducted on geographies consisting of 99,274,303 people shows a mild negative correlation between the proportion of Somalis and percentage of population with at least professional degree education in the United States with a correlation coefficient (R) of -0.392 and weighted average of 4.1%, a difference of 43.8%.
Professional Degree Correlation Summary
| Measurement | Immigrants from Central America | Somali |
| Minimum | 0.36% | 0.40% |
| Maximum | 5.1% | 8.1% |
| Range | 4.7% | 7.7% |
| Mean | 1.9% | 3.4% |
| Median | 1.5% | 3.5% |
| Interquartile 25% (IQ1) | 0.78% | 1.7% |
| Interquartile 75% (IQ3) | 3.0% | 4.6% |
| Interquartile Range (IQR) | 2.3% | 2.9% |
| Standard Deviation (Sample) | 1.3% | 1.9% |
| Standard Deviation (Population) | 1.3% | 1.9% |
Similar Demographics by Professional Degree
Demographics Similar to Immigrants from Central America by Professional Degree
In terms of professional degree, the demographic groups most similar to Immigrants from Central America are Yup'ik (2.9%, a difference of 0.050%), Navajo (2.9%, a difference of 0.12%), Arapaho (2.9%, a difference of 0.19%), Tohono O'odham (2.8%, a difference of 0.83%), and Immigrants from the Azores (2.8%, a difference of 1.5%).
| Demographics | Rating | Rank | Professional Degree |
| Yakama | 0.0 /100 | #332 | Tragic 3.1% |
| Puget Sound Salish | 0.0 /100 | #333 | Tragic 3.1% |
| Pennsylvania Germans | 0.0 /100 | #334 | Tragic 3.0% |
| Natives/Alaskans | 0.0 /100 | #335 | Tragic 3.0% |
| Fijians | 0.0 /100 | #336 | Tragic 2.9% |
| Arapaho | 0.0 /100 | #337 | Tragic 2.9% |
| Navajo | 0.0 /100 | #338 | Tragic 2.9% |
| Immigrants | Central America | 0.0 /100 | #339 | Tragic 2.9% |
| Yup'ik | 0.0 /100 | #340 | Tragic 2.9% |
| Tohono O'odham | 0.0 /100 | #341 | Tragic 2.8% |
| Immigrants | Azores | 0.0 /100 | #342 | Tragic 2.8% |
| Mexicans | 0.0 /100 | #343 | Tragic 2.7% |
| Spanish American Indians | 0.0 /100 | #344 | Tragic 2.7% |
| Immigrants | Mexico | 0.0 /100 | #345 | Tragic 2.6% |
| Lumbee | 0.0 /100 | #346 | Tragic 2.5% |
Demographics Similar to Somalis by Professional Degree
In terms of professional degree, the demographic groups most similar to Somalis are Barbadian (4.1%, a difference of 0.32%), Panamanian (4.1%, a difference of 0.35%), Yugoslavian (4.1%, a difference of 0.42%), Subsaharan African (4.1%, a difference of 0.66%), and Immigrants from Iraq (4.2%, a difference of 0.68%).
| Demographics | Rating | Rank | Professional Degree |
| Immigrants | Middle Africa | 22.1 /100 | #198 | Fair 4.2% |
| Norwegians | 20.5 /100 | #199 | Fair 4.2% |
| Immigrants | North Macedonia | 20.2 /100 | #200 | Fair 4.2% |
| Finns | 18.7 /100 | #201 | Poor 4.2% |
| Immigrants | Iraq | 17.1 /100 | #202 | Poor 4.2% |
| Panamanians | 15.9 /100 | #203 | Poor 4.1% |
| Barbadians | 15.8 /100 | #204 | Poor 4.1% |
| Somalis | 14.8 /100 | #205 | Poor 4.1% |
| Yugoslavians | 13.4 /100 | #206 | Poor 4.1% |
| Sub-Saharan Africans | 12.8 /100 | #207 | Poor 4.1% |
| Immigrants | Somalia | 12.5 /100 | #208 | Poor 4.1% |
| Immigrants | Panama | 12.3 /100 | #209 | Poor 4.1% |
| Immigrants | Nigeria | 11.7 /100 | #210 | Poor 4.1% |
| Germans | 11.6 /100 | #211 | Poor 4.1% |
| Whites/Caucasians | 11.2 /100 | #212 | Poor 4.1% |