Immigrants from Central America vs Immigrants from India In Labor Force | Age 25-29
COMPARE
Immigrants from Central America
Immigrants from India
In Labor Force | Age 25-29
In Labor Force | Age 25-29 Comparison
Immigrants from Central America
Immigrants from India
82.4%
IN LABOR FORCE | AGE 25-29
0.0/ 100
METRIC RATING
309th/ 347
METRIC RANK
85.7%
IN LABOR FORCE | AGE 25-29
99.9/ 100
METRIC RATING
43rd/ 347
METRIC RANK
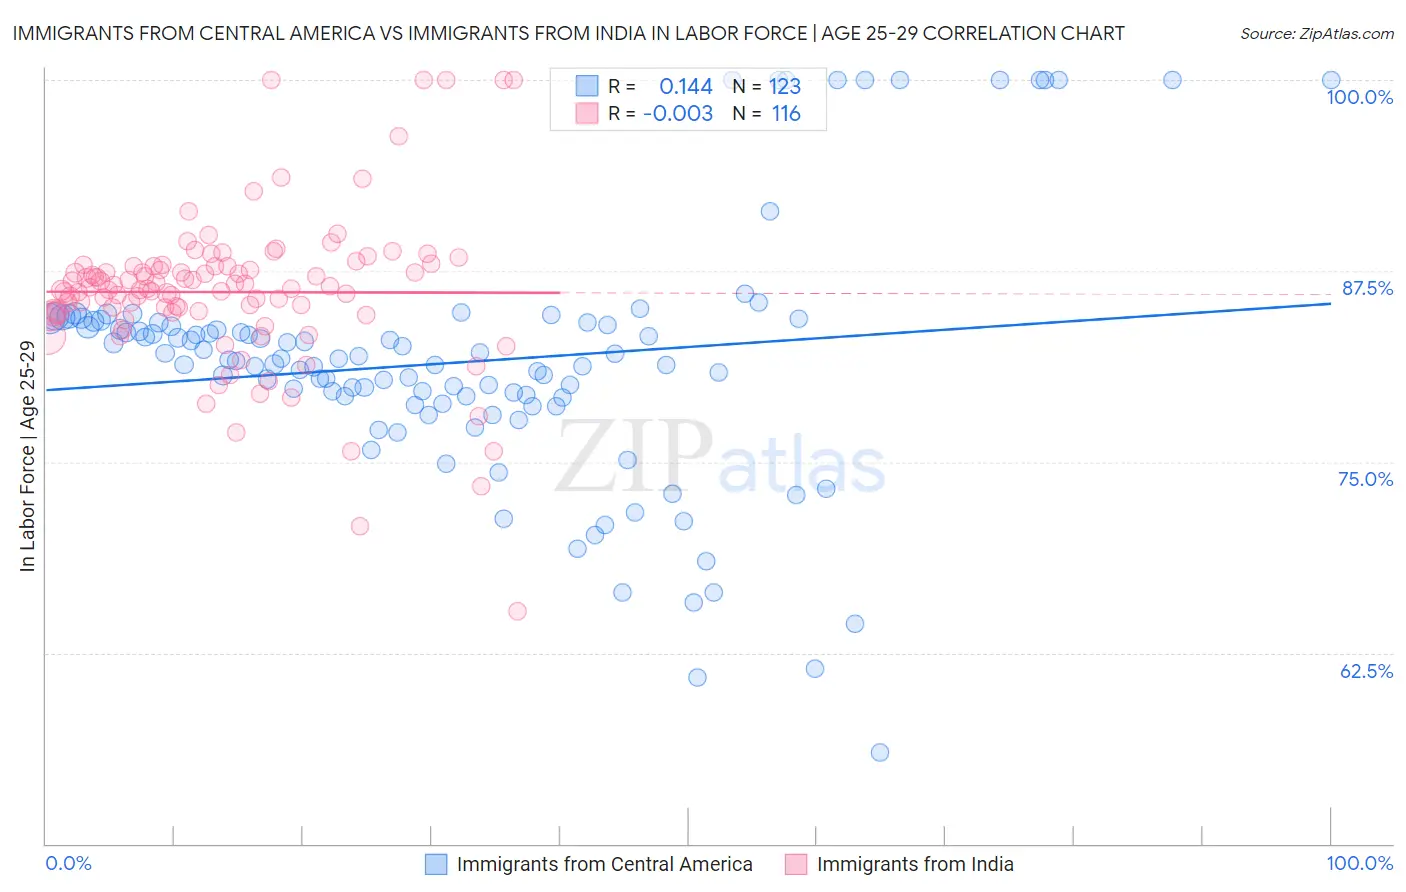
Immigrants from Central America vs Immigrants from India In Labor Force | Age 25-29 Correlation Chart
The statistical analysis conducted on geographies consisting of 535,870,907 people shows a poor positive correlation between the proportion of Immigrants from Central America and labor force participation rate among population between the ages 25 and 29 in the United States with a correlation coefficient (R) of 0.144 and weighted average of 82.4%. Similarly, the statistical analysis conducted on geographies consisting of 433,894,506 people shows no correlation between the proportion of Immigrants from India and labor force participation rate among population between the ages 25 and 29 in the United States with a correlation coefficient (R) of -0.003 and weighted average of 85.7%, a difference of 4.0%.
In Labor Force | Age 25-29 Correlation Summary
| Measurement | Immigrants from Central America | Immigrants from India |
| Minimum | 56.0% | 65.2% |
| Maximum | 100.0% | 100.0% |
| Range | 44.0% | 34.8% |
| Mean | 81.5% | 86.1% |
| Median | 81.6% | 86.3% |
| Interquartile 25% (IQ1) | 78.8% | 84.8% |
| Interquartile 75% (IQ3) | 84.1% | 87.8% |
| Interquartile Range (IQR) | 5.3% | 3.0% |
| Standard Deviation (Sample) | 8.3% | 5.1% |
| Standard Deviation (Population) | 8.2% | 5.1% |
Similar Demographics by In Labor Force | Age 25-29
Demographics Similar to Immigrants from Central America by In Labor Force | Age 25-29
In terms of in labor force | age 25-29, the demographic groups most similar to Immigrants from Central America are Central American Indian (82.4%, a difference of 0.010%), Osage (82.3%, a difference of 0.14%), Alaskan Athabascan (82.3%, a difference of 0.15%), Cajun (82.5%, a difference of 0.16%), and Hispanic or Latino (82.2%, a difference of 0.21%).
| Demographics | Rating | Rank | In Labor Force | Age 25-29 |
| Immigrants | Belize | 0.0 /100 | #302 | Tragic 82.8% |
| Immigrants | Grenada | 0.0 /100 | #303 | Tragic 82.8% |
| Immigrants | St. Vincent and the Grenadines | 0.0 /100 | #304 | Tragic 82.7% |
| Blacks/African Americans | 0.0 /100 | #305 | Tragic 82.6% |
| Blackfeet | 0.0 /100 | #306 | Tragic 82.6% |
| Cajuns | 0.0 /100 | #307 | Tragic 82.5% |
| Central American Indians | 0.0 /100 | #308 | Tragic 82.4% |
| Immigrants | Central America | 0.0 /100 | #309 | Tragic 82.4% |
| Osage | 0.0 /100 | #310 | Tragic 82.3% |
| Alaskan Athabascans | 0.0 /100 | #311 | Tragic 82.3% |
| Hispanics or Latinos | 0.0 /100 | #312 | Tragic 82.2% |
| Yaqui | 0.0 /100 | #313 | Tragic 82.2% |
| Cherokee | 0.0 /100 | #314 | Tragic 82.1% |
| Immigrants | Mexico | 0.0 /100 | #315 | Tragic 82.0% |
| Mexicans | 0.0 /100 | #316 | Tragic 81.9% |
Demographics Similar to Immigrants from India by In Labor Force | Age 25-29
In terms of in labor force | age 25-29, the demographic groups most similar to Immigrants from India are Immigrants from Eritrea (85.7%, a difference of 0.010%), Macedonian (85.7%, a difference of 0.010%), Immigrants from Sierra Leone (85.7%, a difference of 0.010%), Czech (85.6%, a difference of 0.040%), and Immigrants from Greece (85.7%, a difference of 0.050%).
| Demographics | Rating | Rank | In Labor Force | Age 25-29 |
| Immigrants | Nepal | 99.9 /100 | #36 | Exceptional 85.8% |
| Poles | 99.9 /100 | #37 | Exceptional 85.8% |
| Sierra Leoneans | 99.9 /100 | #38 | Exceptional 85.8% |
| Croatians | 99.9 /100 | #39 | Exceptional 85.8% |
| Immigrants | Albania | 99.9 /100 | #40 | Exceptional 85.7% |
| Immigrants | Greece | 99.9 /100 | #41 | Exceptional 85.7% |
| Immigrants | Eritrea | 99.9 /100 | #42 | Exceptional 85.7% |
| Immigrants | India | 99.9 /100 | #43 | Exceptional 85.7% |
| Macedonians | 99.9 /100 | #44 | Exceptional 85.7% |
| Immigrants | Sierra Leone | 99.9 /100 | #45 | Exceptional 85.7% |
| Czechs | 99.8 /100 | #46 | Exceptional 85.6% |
| Turks | 99.8 /100 | #47 | Exceptional 85.6% |
| Italians | 99.8 /100 | #48 | Exceptional 85.6% |
| Swedes | 99.8 /100 | #49 | Exceptional 85.6% |
| Yugoslavians | 99.8 /100 | #50 | Exceptional 85.6% |