Immigrants from Central America vs Central American In Labor Force | Age 25-29
COMPARE
Immigrants from Central America
Central American
In Labor Force | Age 25-29
In Labor Force | Age 25-29 Comparison
Immigrants from Central America
Central Americans
82.4%
IN LABOR FORCE | AGE 25-29
0.0/ 100
METRIC RATING
309th/ 347
METRIC RANK
83.7%
IN LABOR FORCE | AGE 25-29
0.2/ 100
METRIC RATING
250th/ 347
METRIC RANK
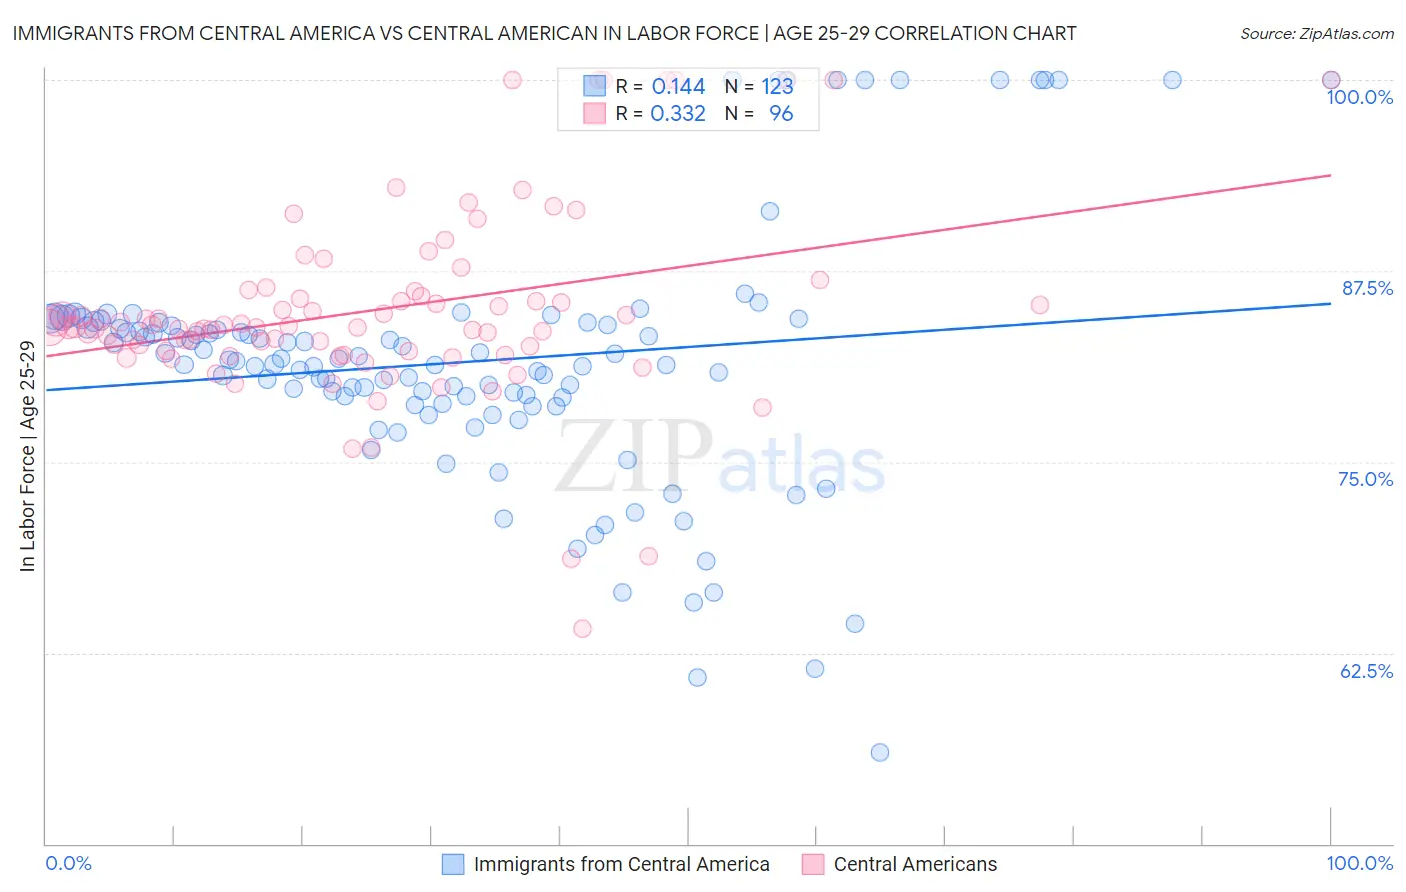
Immigrants from Central America vs Central American In Labor Force | Age 25-29 Correlation Chart
The statistical analysis conducted on geographies consisting of 535,870,907 people shows a poor positive correlation between the proportion of Immigrants from Central America and labor force participation rate among population between the ages 25 and 29 in the United States with a correlation coefficient (R) of 0.144 and weighted average of 82.4%. Similarly, the statistical analysis conducted on geographies consisting of 504,238,703 people shows a mild positive correlation between the proportion of Central Americans and labor force participation rate among population between the ages 25 and 29 in the United States with a correlation coefficient (R) of 0.332 and weighted average of 83.7%, a difference of 1.6%.
In Labor Force | Age 25-29 Correlation Summary
| Measurement | Immigrants from Central America | Central American |
| Minimum | 56.0% | 64.1% |
| Maximum | 100.0% | 100.0% |
| Range | 44.0% | 35.9% |
| Mean | 81.5% | 84.9% |
| Median | 81.6% | 83.8% |
| Interquartile 25% (IQ1) | 78.8% | 82.2% |
| Interquartile 75% (IQ3) | 84.1% | 86.0% |
| Interquartile Range (IQR) | 5.3% | 3.7% |
| Standard Deviation (Sample) | 8.3% | 6.3% |
| Standard Deviation (Population) | 8.2% | 6.3% |
Similar Demographics by In Labor Force | Age 25-29
Demographics Similar to Immigrants from Central America by In Labor Force | Age 25-29
In terms of in labor force | age 25-29, the demographic groups most similar to Immigrants from Central America are Central American Indian (82.4%, a difference of 0.010%), Osage (82.3%, a difference of 0.14%), Alaskan Athabascan (82.3%, a difference of 0.15%), Cajun (82.5%, a difference of 0.16%), and Hispanic or Latino (82.2%, a difference of 0.21%).
| Demographics | Rating | Rank | In Labor Force | Age 25-29 |
| Immigrants | Belize | 0.0 /100 | #302 | Tragic 82.8% |
| Immigrants | Grenada | 0.0 /100 | #303 | Tragic 82.8% |
| Immigrants | St. Vincent and the Grenadines | 0.0 /100 | #304 | Tragic 82.7% |
| Blacks/African Americans | 0.0 /100 | #305 | Tragic 82.6% |
| Blackfeet | 0.0 /100 | #306 | Tragic 82.6% |
| Cajuns | 0.0 /100 | #307 | Tragic 82.5% |
| Central American Indians | 0.0 /100 | #308 | Tragic 82.4% |
| Immigrants | Central America | 0.0 /100 | #309 | Tragic 82.4% |
| Osage | 0.0 /100 | #310 | Tragic 82.3% |
| Alaskan Athabascans | 0.0 /100 | #311 | Tragic 82.3% |
| Hispanics or Latinos | 0.0 /100 | #312 | Tragic 82.2% |
| Yaqui | 0.0 /100 | #313 | Tragic 82.2% |
| Cherokee | 0.0 /100 | #314 | Tragic 82.1% |
| Immigrants | Mexico | 0.0 /100 | #315 | Tragic 82.0% |
| Mexicans | 0.0 /100 | #316 | Tragic 81.9% |
Demographics Similar to Central Americans by In Labor Force | Age 25-29
In terms of in labor force | age 25-29, the demographic groups most similar to Central Americans are Hmong (83.7%, a difference of 0.020%), Bahamian (83.7%, a difference of 0.020%), Guatemalan (83.7%, a difference of 0.020%), Nonimmigrants (83.7%, a difference of 0.030%), and Immigrants from Trinidad and Tobago (83.7%, a difference of 0.030%).
| Demographics | Rating | Rank | In Labor Force | Age 25-29 |
| Salvadorans | 0.5 /100 | #243 | Tragic 83.8% |
| Immigrants | Jamaica | 0.4 /100 | #244 | Tragic 83.8% |
| Iroquois | 0.4 /100 | #245 | Tragic 83.8% |
| Cree | 0.3 /100 | #246 | Tragic 83.8% |
| Immigrants | El Salvador | 0.3 /100 | #247 | Tragic 83.7% |
| Immigrants | Nonimmigrants | 0.3 /100 | #248 | Tragic 83.7% |
| Hmong | 0.3 /100 | #249 | Tragic 83.7% |
| Central Americans | 0.2 /100 | #250 | Tragic 83.7% |
| Bahamians | 0.2 /100 | #251 | Tragic 83.7% |
| Guatemalans | 0.2 /100 | #252 | Tragic 83.7% |
| Immigrants | Trinidad and Tobago | 0.2 /100 | #253 | Tragic 83.7% |
| Spaniards | 0.2 /100 | #254 | Tragic 83.7% |
| Haitians | 0.2 /100 | #255 | Tragic 83.7% |
| Immigrants | Haiti | 0.2 /100 | #256 | Tragic 83.7% |
| Delaware | 0.2 /100 | #257 | Tragic 83.7% |