Immigrants from Central America vs Immigrants from Zimbabwe In Labor Force | Age 30-34
COMPARE
Immigrants from Central America
Immigrants from Zimbabwe
In Labor Force | Age 30-34
In Labor Force | Age 30-34 Comparison
Immigrants from Central America
Immigrants from Zimbabwe
82.5%
IN LABOR FORCE | AGE 30-34
0.0/ 100
METRIC RATING
299th/ 347
METRIC RANK
85.1%
IN LABOR FORCE | AGE 30-34
95.8/ 100
METRIC RATING
108th/ 347
METRIC RANK
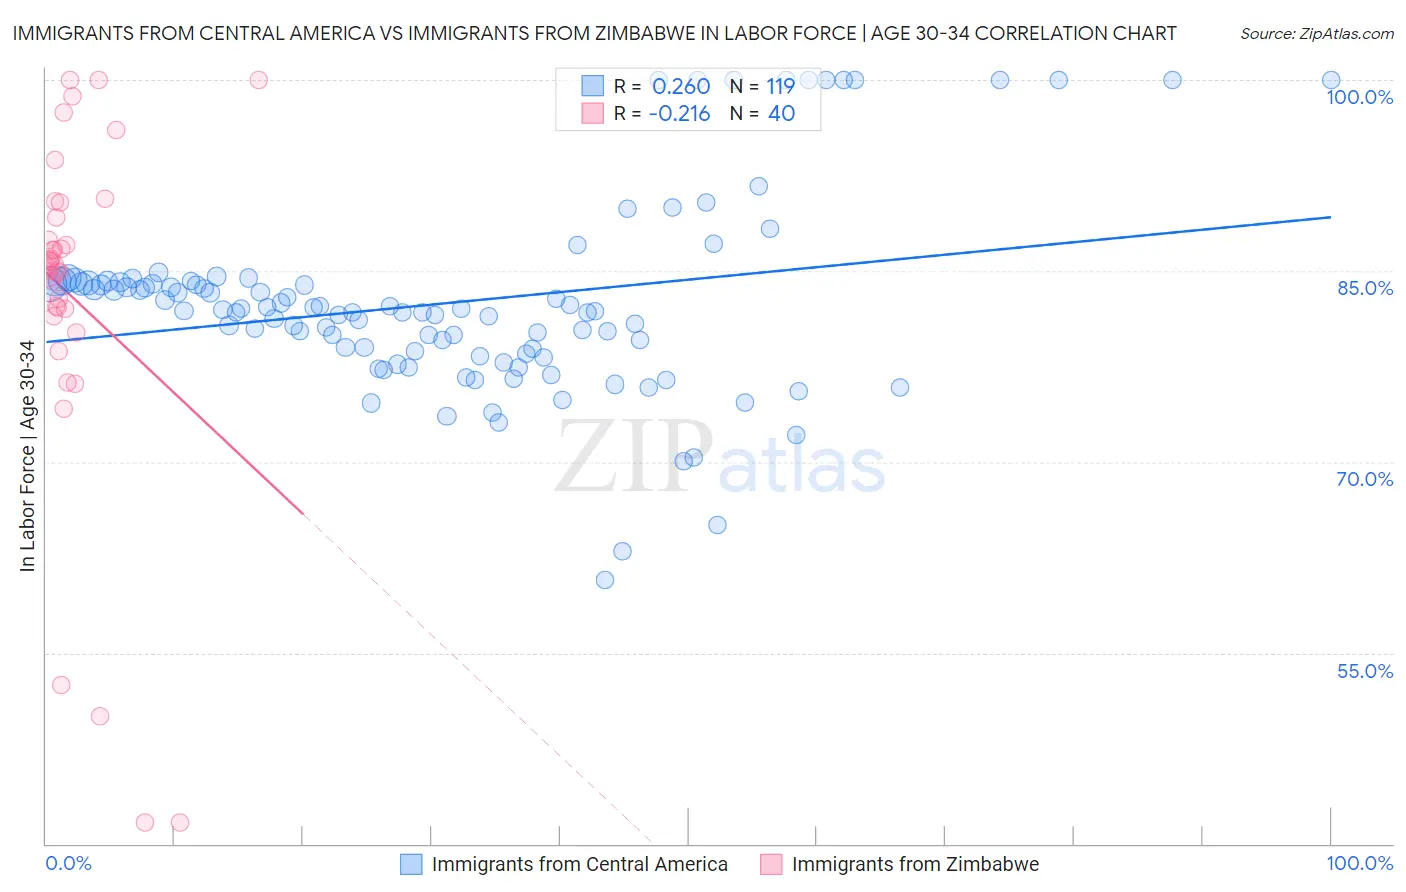
Immigrants from Central America vs Immigrants from Zimbabwe In Labor Force | Age 30-34 Correlation Chart
The statistical analysis conducted on geographies consisting of 535,746,128 people shows a weak positive correlation between the proportion of Immigrants from Central America and labor force participation rate among population between the ages 30 and 34 in the United States with a correlation coefficient (R) of 0.260 and weighted average of 82.5%. Similarly, the statistical analysis conducted on geographies consisting of 117,799,527 people shows a weak negative correlation between the proportion of Immigrants from Zimbabwe and labor force participation rate among population between the ages 30 and 34 in the United States with a correlation coefficient (R) of -0.216 and weighted average of 85.1%, a difference of 3.2%.
In Labor Force | Age 30-34 Correlation Summary
| Measurement | Immigrants from Central America | Immigrants from Zimbabwe |
| Minimum | 60.8% | 41.7% |
| Maximum | 100.0% | 100.0% |
| Range | 39.2% | 58.3% |
| Mean | 82.5% | 82.9% |
| Median | 81.9% | 85.4% |
| Interquartile 25% (IQ1) | 78.4% | 81.8% |
| Interquartile 75% (IQ3) | 84.1% | 89.8% |
| Interquartile Range (IQR) | 5.7% | 8.0% |
| Standard Deviation (Sample) | 7.6% | 13.9% |
| Standard Deviation (Population) | 7.5% | 13.8% |
Similar Demographics by In Labor Force | Age 30-34
Demographics Similar to Immigrants from Central America by In Labor Force | Age 30-34
In terms of in labor force | age 30-34, the demographic groups most similar to Immigrants from Central America are Hmong (82.4%, a difference of 0.060%), Hispanic or Latino (82.4%, a difference of 0.070%), Ottawa (82.4%, a difference of 0.10%), Immigrants from Micronesia (82.4%, a difference of 0.11%), and Comanche (82.6%, a difference of 0.13%).
| Demographics | Rating | Rank | In Labor Force | Age 30-34 |
| Blacks/African Americans | 0.0 /100 | #292 | Tragic 82.8% |
| Nepalese | 0.0 /100 | #293 | Tragic 82.7% |
| Americans | 0.0 /100 | #294 | Tragic 82.7% |
| Pennsylvania Germans | 0.0 /100 | #295 | Tragic 82.6% |
| Chippewa | 0.0 /100 | #296 | Tragic 82.6% |
| Comanche | 0.0 /100 | #297 | Tragic 82.6% |
| Aleuts | 0.0 /100 | #298 | Tragic 82.6% |
| Immigrants | Central America | 0.0 /100 | #299 | Tragic 82.5% |
| Hmong | 0.0 /100 | #300 | Tragic 82.4% |
| Hispanics or Latinos | 0.0 /100 | #301 | Tragic 82.4% |
| Ottawa | 0.0 /100 | #302 | Tragic 82.4% |
| Immigrants | Micronesia | 0.0 /100 | #303 | Tragic 82.4% |
| Tlingit-Haida | 0.0 /100 | #304 | Tragic 82.3% |
| Osage | 0.0 /100 | #305 | Tragic 82.3% |
| Spanish American Indians | 0.0 /100 | #306 | Tragic 82.2% |
Demographics Similar to Immigrants from Zimbabwe by In Labor Force | Age 30-34
In terms of in labor force | age 30-34, the demographic groups most similar to Immigrants from Zimbabwe are Argentinean (85.1%, a difference of 0.0%), Immigrants from Northern Africa (85.2%, a difference of 0.020%), Immigrants from South Africa (85.1%, a difference of 0.020%), Alsatian (85.2%, a difference of 0.030%), and Immigrants from Middle Africa (85.2%, a difference of 0.030%).
| Demographics | Rating | Rank | In Labor Force | Age 30-34 |
| Immigrants | Belarus | 96.9 /100 | #101 | Exceptional 85.2% |
| Immigrants | Austria | 96.8 /100 | #102 | Exceptional 85.2% |
| Ukrainians | 96.6 /100 | #103 | Exceptional 85.2% |
| Immigrants | Ghana | 96.5 /100 | #104 | Exceptional 85.2% |
| Alsatians | 96.3 /100 | #105 | Exceptional 85.2% |
| Immigrants | Middle Africa | 96.3 /100 | #106 | Exceptional 85.2% |
| Immigrants | Northern Africa | 96.3 /100 | #107 | Exceptional 85.2% |
| Immigrants | Zimbabwe | 95.8 /100 | #108 | Exceptional 85.1% |
| Argentineans | 95.8 /100 | #109 | Exceptional 85.1% |
| Immigrants | South Africa | 95.3 /100 | #110 | Exceptional 85.1% |
| Immigrants | Scotland | 94.9 /100 | #111 | Exceptional 85.1% |
| Immigrants | Hungary | 94.8 /100 | #112 | Exceptional 85.1% |
| Immigrants | Romania | 94.7 /100 | #113 | Exceptional 85.1% |
| Yugoslavians | 94.7 /100 | #114 | Exceptional 85.1% |
| Immigrants | South Central Asia | 94.6 /100 | #115 | Exceptional 85.1% |