Immigrants from Central America vs Maltese 10th Grade
COMPARE
Immigrants from Central America
Maltese
10th Grade
10th Grade Comparison
Immigrants from Central America
Maltese
86.6%
10TH GRADE
0.0/ 100
METRIC RATING
345th/ 347
METRIC RANK
95.5%
10TH GRADE
100.0/ 100
METRIC RATING
25th/ 347
METRIC RANK
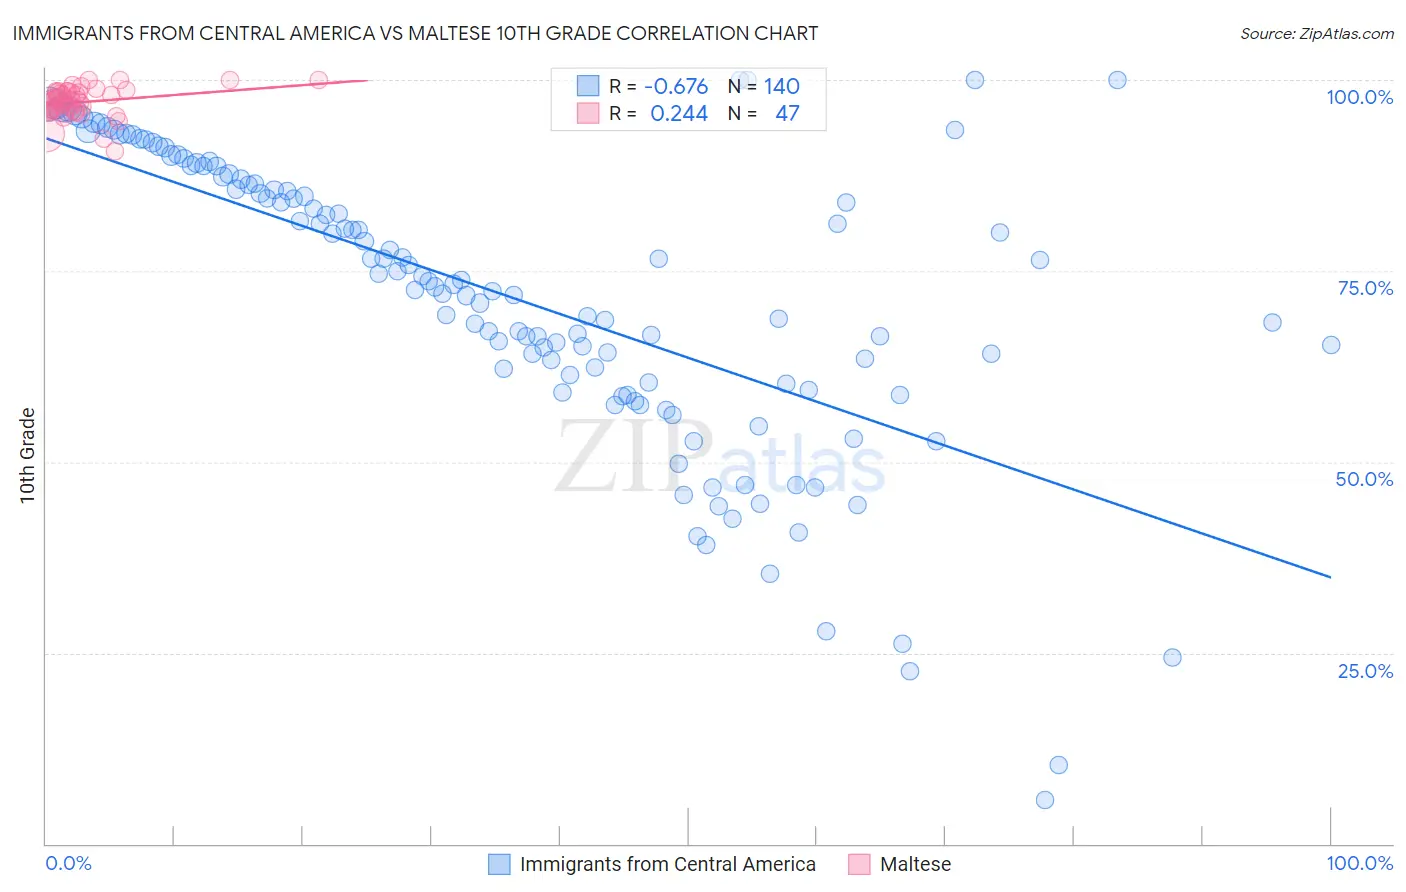
Immigrants from Central America vs Maltese 10th Grade Correlation Chart
The statistical analysis conducted on geographies consisting of 536,553,521 people shows a significant negative correlation between the proportion of Immigrants from Central America and percentage of population with at least 10th grade education in the United States with a correlation coefficient (R) of -0.676 and weighted average of 86.6%. Similarly, the statistical analysis conducted on geographies consisting of 126,475,193 people shows a weak positive correlation between the proportion of Maltese and percentage of population with at least 10th grade education in the United States with a correlation coefficient (R) of 0.244 and weighted average of 95.5%, a difference of 10.2%.
10th Grade Correlation Summary
| Measurement | Immigrants from Central America | Maltese |
| Minimum | 5.7% | 90.8% |
| Maximum | 100.0% | 100.0% |
| Range | 94.3% | 9.2% |
| Mean | 71.5% | 97.1% |
| Median | 73.5% | 97.4% |
| Interquartile 25% (IQ1) | 60.3% | 96.0% |
| Interquartile 75% (IQ3) | 86.7% | 98.5% |
| Interquartile Range (IQR) | 26.4% | 2.6% |
| Standard Deviation (Sample) | 19.3% | 2.0% |
| Standard Deviation (Population) | 19.3% | 1.9% |
Similar Demographics by 10th Grade
Demographics Similar to Immigrants from Central America by 10th Grade
In terms of 10th grade, the demographic groups most similar to Immigrants from Central America are Immigrants from El Salvador (86.8%, a difference of 0.18%), Yakama (86.9%, a difference of 0.32%), Spanish American Indian (86.2%, a difference of 0.45%), Immigrants from Mexico (86.2%, a difference of 0.47%), and Immigrants from Guatemala (87.4%, a difference of 0.90%).
| Demographics | Rating | Rank | 10th Grade |
| Hondurans | 0.0 /100 | #333 | Tragic 89.0% |
| Hispanics or Latinos | 0.0 /100 | #334 | Tragic 88.9% |
| Immigrants | Dominican Republic | 0.0 /100 | #335 | Tragic 88.7% |
| Immigrants | Honduras | 0.0 /100 | #336 | Tragic 88.5% |
| Central Americans | 0.0 /100 | #337 | Tragic 88.4% |
| Immigrants | Latin America | 0.0 /100 | #338 | Tragic 88.3% |
| Guatemalans | 0.0 /100 | #339 | Tragic 87.9% |
| Mexicans | 0.0 /100 | #340 | Tragic 87.8% |
| Salvadorans | 0.0 /100 | #341 | Tragic 87.5% |
| Immigrants | Guatemala | 0.0 /100 | #342 | Tragic 87.4% |
| Yakama | 0.0 /100 | #343 | Tragic 86.9% |
| Immigrants | El Salvador | 0.0 /100 | #344 | Tragic 86.8% |
| Immigrants | Central America | 0.0 /100 | #345 | Tragic 86.6% |
| Spanish American Indians | 0.0 /100 | #346 | Tragic 86.2% |
| Immigrants | Mexico | 0.0 /100 | #347 | Tragic 86.2% |
Demographics Similar to Maltese by 10th Grade
In terms of 10th grade, the demographic groups most similar to Maltese are European (95.5%, a difference of 0.0%), Czech (95.5%, a difference of 0.020%), Welsh (95.5%, a difference of 0.020%), Eastern European (95.5%, a difference of 0.030%), and Alaskan Athabascan (95.4%, a difference of 0.040%).
| Demographics | Rating | Rank | 10th Grade |
| Italians | 100.0 /100 | #18 | Exceptional 95.6% |
| Scandinavians | 100.0 /100 | #19 | Exceptional 95.6% |
| Chinese | 100.0 /100 | #20 | Exceptional 95.5% |
| Dutch | 100.0 /100 | #21 | Exceptional 95.5% |
| Eastern Europeans | 100.0 /100 | #22 | Exceptional 95.5% |
| Czechs | 100.0 /100 | #23 | Exceptional 95.5% |
| Europeans | 100.0 /100 | #24 | Exceptional 95.5% |
| Maltese | 100.0 /100 | #25 | Exceptional 95.5% |
| Welsh | 100.0 /100 | #26 | Exceptional 95.5% |
| Alaskan Athabascans | 100.0 /100 | #27 | Exceptional 95.4% |
| Luxembourgers | 100.0 /100 | #28 | Exceptional 95.4% |
| Bulgarians | 100.0 /100 | #29 | Exceptional 95.4% |
| Belgians | 100.0 /100 | #30 | Exceptional 95.4% |
| Iranians | 100.0 /100 | #31 | Exceptional 95.3% |
| Hungarians | 100.0 /100 | #32 | Exceptional 95.3% |