Immigrants from Central America vs Immigrants from Turkey In Labor Force | Age 30-34
COMPARE
Immigrants from Central America
Immigrants from Turkey
In Labor Force | Age 30-34
In Labor Force | Age 30-34 Comparison
Immigrants from Central America
Immigrants from Turkey
82.5%
IN LABOR FORCE | AGE 30-34
0.0/ 100
METRIC RATING
299th/ 347
METRIC RANK
85.5%
IN LABOR FORCE | AGE 30-34
99.6/ 100
METRIC RATING
55th/ 347
METRIC RANK
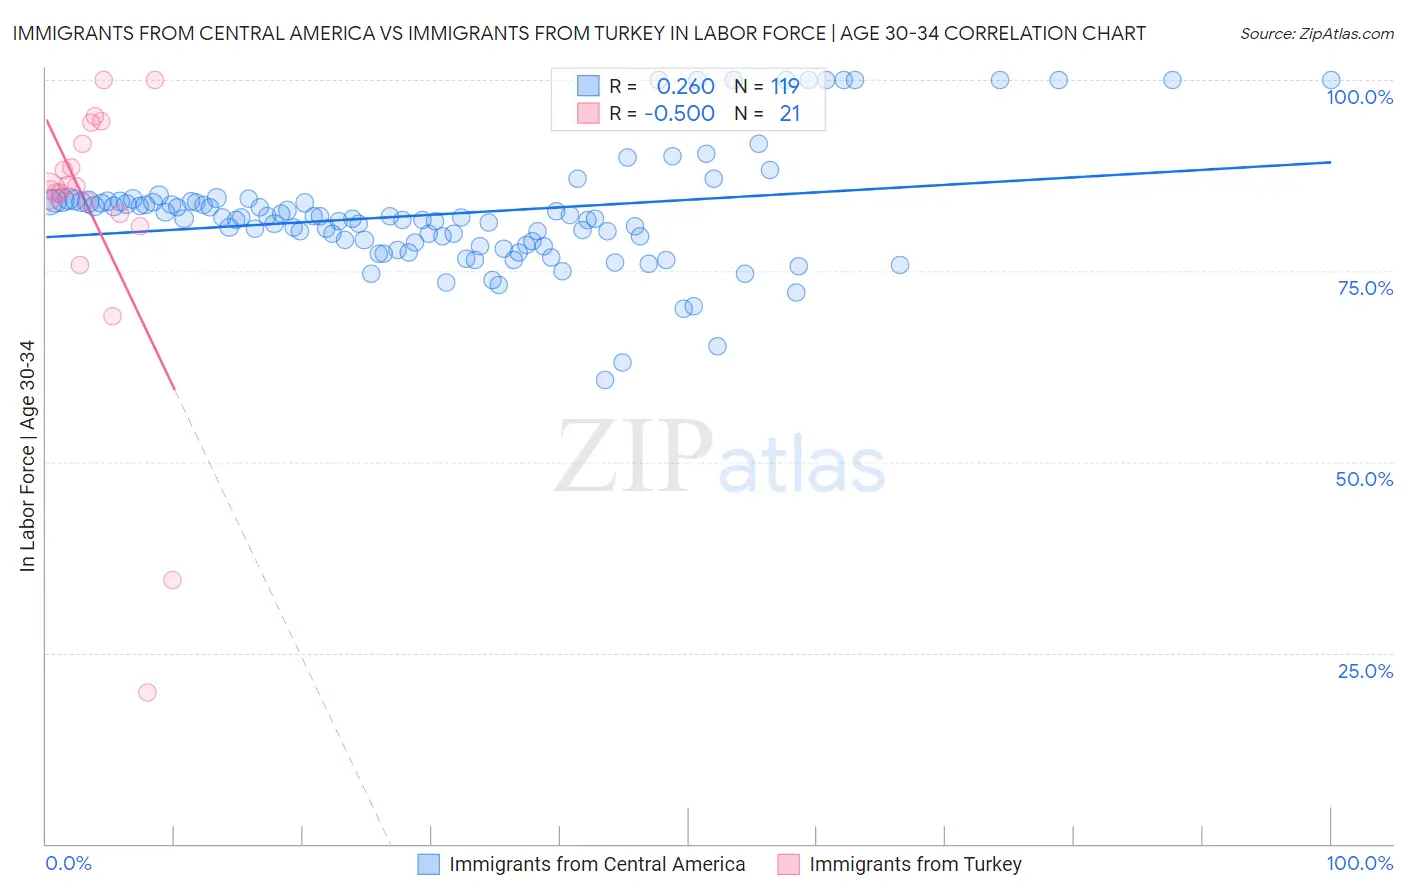
Immigrants from Central America vs Immigrants from Turkey In Labor Force | Age 30-34 Correlation Chart
The statistical analysis conducted on geographies consisting of 535,746,128 people shows a weak positive correlation between the proportion of Immigrants from Central America and labor force participation rate among population between the ages 30 and 34 in the United States with a correlation coefficient (R) of 0.260 and weighted average of 82.5%. Similarly, the statistical analysis conducted on geographies consisting of 222,992,305 people shows a moderate negative correlation between the proportion of Immigrants from Turkey and labor force participation rate among population between the ages 30 and 34 in the United States with a correlation coefficient (R) of -0.500 and weighted average of 85.5%, a difference of 3.7%.
In Labor Force | Age 30-34 Correlation Summary
| Measurement | Immigrants from Central America | Immigrants from Turkey |
| Minimum | 60.8% | 19.8% |
| Maximum | 100.0% | 100.0% |
| Range | 39.2% | 80.2% |
| Mean | 82.5% | 81.6% |
| Median | 81.9% | 85.6% |
| Interquartile 25% (IQ1) | 78.4% | 81.7% |
| Interquartile 75% (IQ3) | 84.1% | 93.0% |
| Interquartile Range (IQR) | 5.7% | 11.3% |
| Standard Deviation (Sample) | 7.6% | 19.7% |
| Standard Deviation (Population) | 7.5% | 19.2% |
Similar Demographics by In Labor Force | Age 30-34
Demographics Similar to Immigrants from Central America by In Labor Force | Age 30-34
In terms of in labor force | age 30-34, the demographic groups most similar to Immigrants from Central America are Hmong (82.4%, a difference of 0.060%), Hispanic or Latino (82.4%, a difference of 0.070%), Ottawa (82.4%, a difference of 0.10%), Immigrants from Micronesia (82.4%, a difference of 0.11%), and Comanche (82.6%, a difference of 0.13%).
| Demographics | Rating | Rank | In Labor Force | Age 30-34 |
| Blacks/African Americans | 0.0 /100 | #292 | Tragic 82.8% |
| Nepalese | 0.0 /100 | #293 | Tragic 82.7% |
| Americans | 0.0 /100 | #294 | Tragic 82.7% |
| Pennsylvania Germans | 0.0 /100 | #295 | Tragic 82.6% |
| Chippewa | 0.0 /100 | #296 | Tragic 82.6% |
| Comanche | 0.0 /100 | #297 | Tragic 82.6% |
| Aleuts | 0.0 /100 | #298 | Tragic 82.6% |
| Immigrants | Central America | 0.0 /100 | #299 | Tragic 82.5% |
| Hmong | 0.0 /100 | #300 | Tragic 82.4% |
| Hispanics or Latinos | 0.0 /100 | #301 | Tragic 82.4% |
| Ottawa | 0.0 /100 | #302 | Tragic 82.4% |
| Immigrants | Micronesia | 0.0 /100 | #303 | Tragic 82.4% |
| Tlingit-Haida | 0.0 /100 | #304 | Tragic 82.3% |
| Osage | 0.0 /100 | #305 | Tragic 82.3% |
| Spanish American Indians | 0.0 /100 | #306 | Tragic 82.2% |
Demographics Similar to Immigrants from Turkey by In Labor Force | Age 30-34
In terms of in labor force | age 30-34, the demographic groups most similar to Immigrants from Turkey are Immigrants from Kenya (85.5%, a difference of 0.0%), Czech (85.5%, a difference of 0.010%), Russian (85.5%, a difference of 0.010%), Polish (85.5%, a difference of 0.010%), and Filipino (85.5%, a difference of 0.020%).
| Demographics | Rating | Rank | In Labor Force | Age 30-34 |
| Immigrants | Sweden | 99.8 /100 | #48 | Exceptional 85.6% |
| Lithuanians | 99.8 /100 | #49 | Exceptional 85.6% |
| Immigrants | Australia | 99.8 /100 | #50 | Exceptional 85.6% |
| Cape Verdeans | 99.7 /100 | #51 | Exceptional 85.6% |
| Slovenes | 99.7 /100 | #52 | Exceptional 85.6% |
| Filipinos | 99.6 /100 | #53 | Exceptional 85.5% |
| Immigrants | Kenya | 99.6 /100 | #54 | Exceptional 85.5% |
| Immigrants | Turkey | 99.6 /100 | #55 | Exceptional 85.5% |
| Czechs | 99.6 /100 | #56 | Exceptional 85.5% |
| Russians | 99.6 /100 | #57 | Exceptional 85.5% |
| Poles | 99.6 /100 | #58 | Exceptional 85.5% |
| Immigrants | Poland | 99.5 /100 | #59 | Exceptional 85.5% |
| Immigrants | France | 99.5 /100 | #60 | Exceptional 85.5% |
| Immigrants | Brazil | 99.5 /100 | #61 | Exceptional 85.5% |
| Soviet Union | 99.4 /100 | #62 | Exceptional 85.5% |