Immigrants from Caribbean vs Greek In Labor Force | Age 30-34
COMPARE
Immigrants from Caribbean
Greek
In Labor Force | Age 30-34
In Labor Force | Age 30-34 Comparison
Immigrants from Caribbean
Greeks
84.0%
IN LABOR FORCE | AGE 30-34
1.1/ 100
METRIC RATING
243rd/ 347
METRIC RANK
85.3%
IN LABOR FORCE | AGE 30-34
98.6/ 100
METRIC RATING
84th/ 347
METRIC RANK
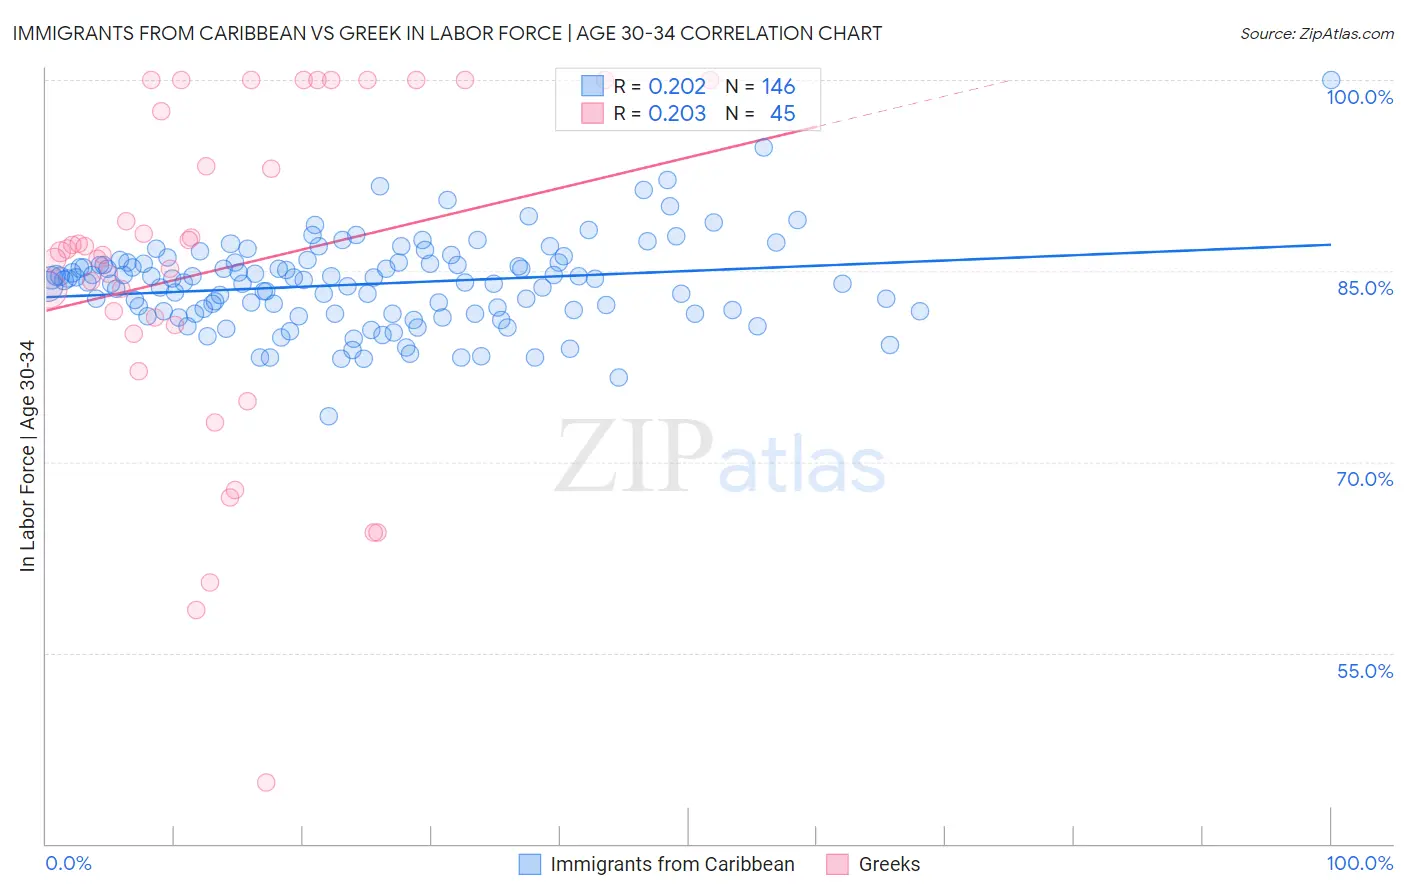
Immigrants from Caribbean vs Greek In Labor Force | Age 30-34 Correlation Chart
The statistical analysis conducted on geographies consisting of 449,684,451 people shows a weak positive correlation between the proportion of Immigrants from Caribbean and labor force participation rate among population between the ages 30 and 34 in the United States with a correlation coefficient (R) of 0.202 and weighted average of 84.0%. Similarly, the statistical analysis conducted on geographies consisting of 482,259,585 people shows a weak positive correlation between the proportion of Greeks and labor force participation rate among population between the ages 30 and 34 in the United States with a correlation coefficient (R) of 0.203 and weighted average of 85.3%, a difference of 1.5%.
In Labor Force | Age 30-34 Correlation Summary
| Measurement | Immigrants from Caribbean | Greek |
| Minimum | 73.6% | 44.8% |
| Maximum | 100.0% | 100.0% |
| Range | 26.4% | 55.2% |
| Mean | 84.0% | 85.0% |
| Median | 84.2% | 86.5% |
| Interquartile 25% (IQ1) | 81.6% | 80.4% |
| Interquartile 75% (IQ3) | 85.6% | 98.8% |
| Interquartile Range (IQR) | 4.0% | 18.4% |
| Standard Deviation (Sample) | 3.5% | 13.1% |
| Standard Deviation (Population) | 3.5% | 13.0% |
Similar Demographics by In Labor Force | Age 30-34
Demographics Similar to Immigrants from Caribbean by In Labor Force | Age 30-34
In terms of in labor force | age 30-34, the demographic groups most similar to Immigrants from Caribbean are Immigrants from Oceania (84.0%, a difference of 0.010%), Immigrants from Portugal (84.0%, a difference of 0.020%), Basque (84.0%, a difference of 0.030%), Immigrants from Venezuela (84.0%, a difference of 0.030%), and Central American (84.0%, a difference of 0.030%).
| Demographics | Rating | Rank | In Labor Force | Age 30-34 |
| U.S. Virgin Islanders | 1.5 /100 | #236 | Tragic 84.1% |
| Celtics | 1.4 /100 | #237 | Tragic 84.1% |
| Immigrants | Barbados | 1.4 /100 | #238 | Tragic 84.0% |
| English | 1.4 /100 | #239 | Tragic 84.0% |
| Venezuelans | 1.3 /100 | #240 | Tragic 84.0% |
| Immigrants | Portugal | 1.2 /100 | #241 | Tragic 84.0% |
| Immigrants | Oceania | 1.1 /100 | #242 | Tragic 84.0% |
| Immigrants | Caribbean | 1.1 /100 | #243 | Tragic 84.0% |
| Basques | 0.9 /100 | #244 | Tragic 84.0% |
| Immigrants | Venezuela | 0.9 /100 | #245 | Tragic 84.0% |
| Central Americans | 0.9 /100 | #246 | Tragic 84.0% |
| British West Indians | 0.8 /100 | #247 | Tragic 84.0% |
| Portuguese | 0.8 /100 | #248 | Tragic 84.0% |
| Immigrants | Dominica | 0.7 /100 | #249 | Tragic 84.0% |
| Immigrants | Iraq | 0.7 /100 | #250 | Tragic 83.9% |
Demographics Similar to Greeks by In Labor Force | Age 30-34
In terms of in labor force | age 30-34, the demographic groups most similar to Greeks are Immigrants from Europe (85.3%, a difference of 0.0%), Slovak (85.3%, a difference of 0.010%), Immigrants from Africa (85.3%, a difference of 0.010%), Mongolian (85.3%, a difference of 0.010%), and Immigrants from Switzerland (85.3%, a difference of 0.020%).
| Demographics | Rating | Rank | In Labor Force | Age 30-34 |
| Immigrants | Eastern Asia | 98.9 /100 | #77 | Exceptional 85.4% |
| Immigrants | Singapore | 98.8 /100 | #78 | Exceptional 85.3% |
| Immigrants | Switzerland | 98.7 /100 | #79 | Exceptional 85.3% |
| Immigrants | Russia | 98.7 /100 | #80 | Exceptional 85.3% |
| Slovaks | 98.7 /100 | #81 | Exceptional 85.3% |
| Immigrants | Africa | 98.6 /100 | #82 | Exceptional 85.3% |
| Immigrants | Europe | 98.6 /100 | #83 | Exceptional 85.3% |
| Greeks | 98.6 /100 | #84 | Exceptional 85.3% |
| Mongolians | 98.5 /100 | #85 | Exceptional 85.3% |
| Immigrants | Taiwan | 98.3 /100 | #86 | Exceptional 85.3% |
| Immigrants | Northern Europe | 98.2 /100 | #87 | Exceptional 85.3% |
| Immigrants | Belgium | 98.2 /100 | #88 | Exceptional 85.3% |
| Immigrants | Kazakhstan | 98.1 /100 | #89 | Exceptional 85.3% |
| Burmese | 97.9 /100 | #90 | Exceptional 85.3% |
| Immigrants | Moldova | 97.9 /100 | #91 | Exceptional 85.3% |