Dominican vs Chinese In Labor Force | Age 30-34
COMPARE
Dominican
Chinese
In Labor Force | Age 30-34
In Labor Force | Age 30-34 Comparison
Dominicans
Chinese
83.8%
IN LABOR FORCE | AGE 30-34
0.2/ 100
METRIC RATING
262nd/ 347
METRIC RANK
85.0%
IN LABOR FORCE | AGE 30-34
89.6/ 100
METRIC RATING
131st/ 347
METRIC RANK
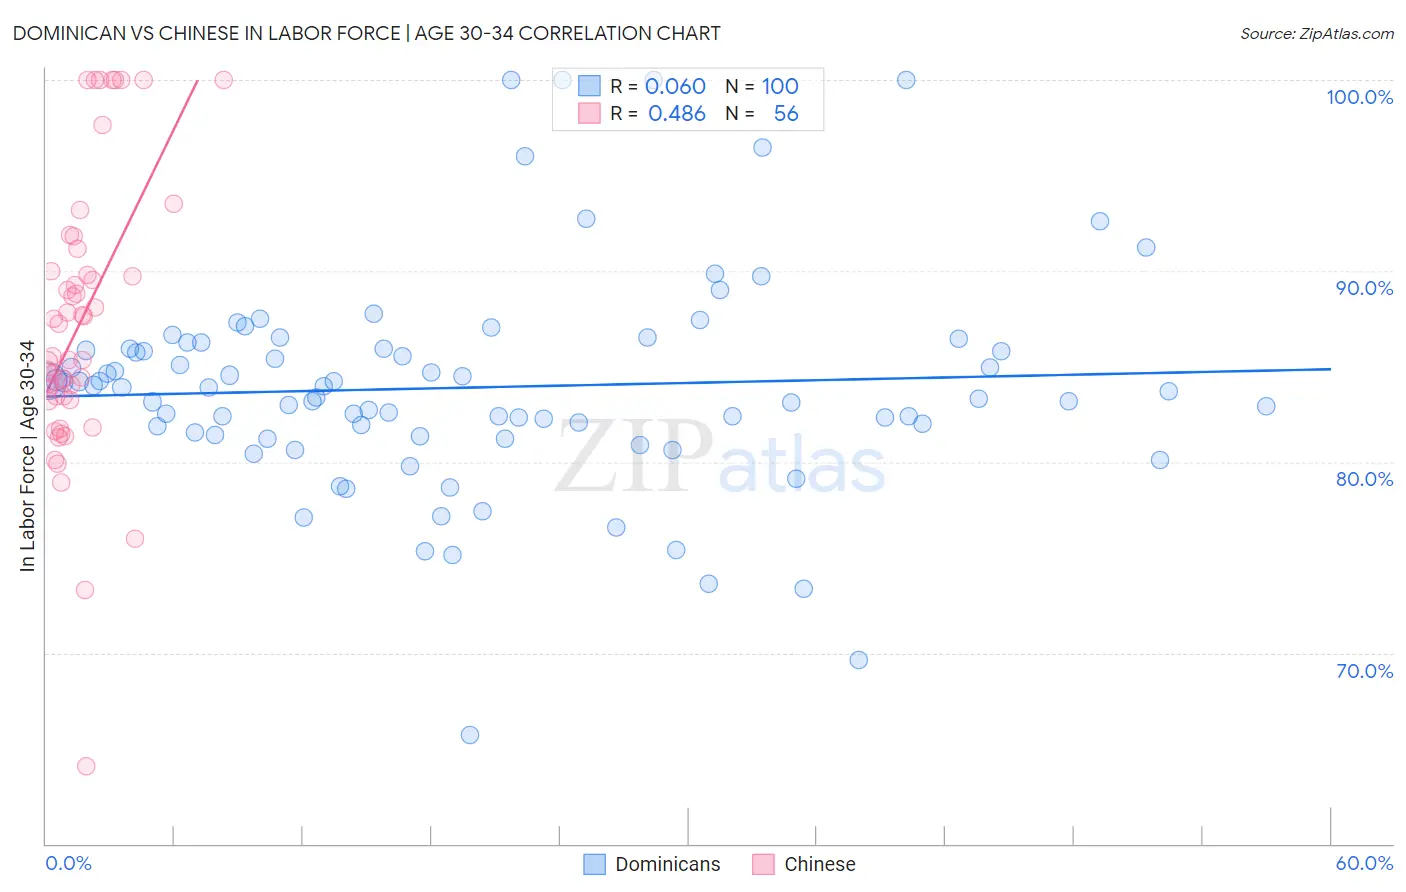
Dominican vs Chinese In Labor Force | Age 30-34 Correlation Chart
The statistical analysis conducted on geographies consisting of 354,830,681 people shows a slight positive correlation between the proportion of Dominicans and labor force participation rate among population between the ages 30 and 34 in the United States with a correlation coefficient (R) of 0.060 and weighted average of 83.8%. Similarly, the statistical analysis conducted on geographies consisting of 64,801,795 people shows a moderate positive correlation between the proportion of Chinese and labor force participation rate among population between the ages 30 and 34 in the United States with a correlation coefficient (R) of 0.486 and weighted average of 85.0%, a difference of 1.5%.
In Labor Force | Age 30-34 Correlation Summary
| Measurement | Dominican | Chinese |
| Minimum | 65.7% | 64.1% |
| Maximum | 100.0% | 100.0% |
| Range | 34.3% | 35.9% |
| Mean | 83.9% | 87.3% |
| Median | 83.8% | 86.4% |
| Interquartile 25% (IQ1) | 81.5% | 83.3% |
| Interquartile 75% (IQ3) | 85.9% | 90.6% |
| Interquartile Range (IQR) | 4.5% | 7.3% |
| Standard Deviation (Sample) | 5.7% | 7.3% |
| Standard Deviation (Population) | 5.7% | 7.3% |
Similar Demographics by In Labor Force | Age 30-34
Demographics Similar to Dominicans by In Labor Force | Age 30-34
In terms of in labor force | age 30-34, the demographic groups most similar to Dominicans are Immigrants from Guyana (83.8%, a difference of 0.0%), Immigrants from Dominican Republic (83.8%, a difference of 0.020%), Guyanese (83.8%, a difference of 0.020%), Honduran (83.8%, a difference of 0.040%), and Scotch-Irish (83.8%, a difference of 0.040%).
| Demographics | Rating | Rank | In Labor Force | Age 30-34 |
| Whites/Caucasians | 0.5 /100 | #255 | Tragic 83.9% |
| Immigrants | Lebanon | 0.4 /100 | #256 | Tragic 83.9% |
| Iraqis | 0.3 /100 | #257 | Tragic 83.8% |
| Hondurans | 0.3 /100 | #258 | Tragic 83.8% |
| Scotch-Irish | 0.3 /100 | #259 | Tragic 83.8% |
| Immigrants | Dominican Republic | 0.3 /100 | #260 | Tragic 83.8% |
| Guyanese | 0.3 /100 | #261 | Tragic 83.8% |
| Dominicans | 0.2 /100 | #262 | Tragic 83.8% |
| Immigrants | Guyana | 0.2 /100 | #263 | Tragic 83.8% |
| Guatemalans | 0.2 /100 | #264 | Tragic 83.7% |
| Immigrants | Honduras | 0.1 /100 | #265 | Tragic 83.7% |
| Immigrants | Guatemala | 0.1 /100 | #266 | Tragic 83.7% |
| Spaniards | 0.1 /100 | #267 | Tragic 83.6% |
| Immigrants | Bangladesh | 0.1 /100 | #268 | Tragic 83.6% |
| Vietnamese | 0.1 /100 | #269 | Tragic 83.6% |
Demographics Similar to Chinese by In Labor Force | Age 30-34
In terms of in labor force | age 30-34, the demographic groups most similar to Chinese are Immigrants from Israel (85.0%, a difference of 0.0%), New Zealander (85.0%, a difference of 0.0%), Immigrants from Western Africa (85.0%, a difference of 0.010%), Immigrants from Spain (85.0%, a difference of 0.010%), and Immigrants from Chile (85.0%, a difference of 0.010%).
| Demographics | Rating | Rank | In Labor Force | Age 30-34 |
| Australians | 92.0 /100 | #124 | Exceptional 85.0% |
| Immigrants | Jordan | 91.5 /100 | #125 | Exceptional 85.0% |
| Austrians | 90.9 /100 | #126 | Exceptional 85.0% |
| Slavs | 90.7 /100 | #127 | Exceptional 85.0% |
| Immigrants | Argentina | 90.6 /100 | #128 | Exceptional 85.0% |
| Immigrants | Western Africa | 90.2 /100 | #129 | Exceptional 85.0% |
| Immigrants | Spain | 90.0 /100 | #130 | Exceptional 85.0% |
| Chinese | 89.6 /100 | #131 | Excellent 85.0% |
| Immigrants | Israel | 89.5 /100 | #132 | Excellent 85.0% |
| New Zealanders | 89.5 /100 | #133 | Excellent 85.0% |
| Immigrants | Chile | 89.2 /100 | #134 | Excellent 85.0% |
| Immigrants | Asia | 88.9 /100 | #135 | Excellent 85.0% |
| Jordanians | 88.6 /100 | #136 | Excellent 85.0% |
| South Africans | 88.0 /100 | #137 | Excellent 85.0% |
| Sri Lankans | 87.8 /100 | #138 | Excellent 85.0% |