Immigrants from Malaysia vs Chinese In Labor Force | Age 30-34
COMPARE
Immigrants from Malaysia
Chinese
In Labor Force | Age 30-34
In Labor Force | Age 30-34 Comparison
Immigrants from Malaysia
Chinese
85.1%
IN LABOR FORCE | AGE 30-34
94.2/ 100
METRIC RATING
118th/ 347
METRIC RANK
85.0%
IN LABOR FORCE | AGE 30-34
89.6/ 100
METRIC RATING
131st/ 347
METRIC RANK
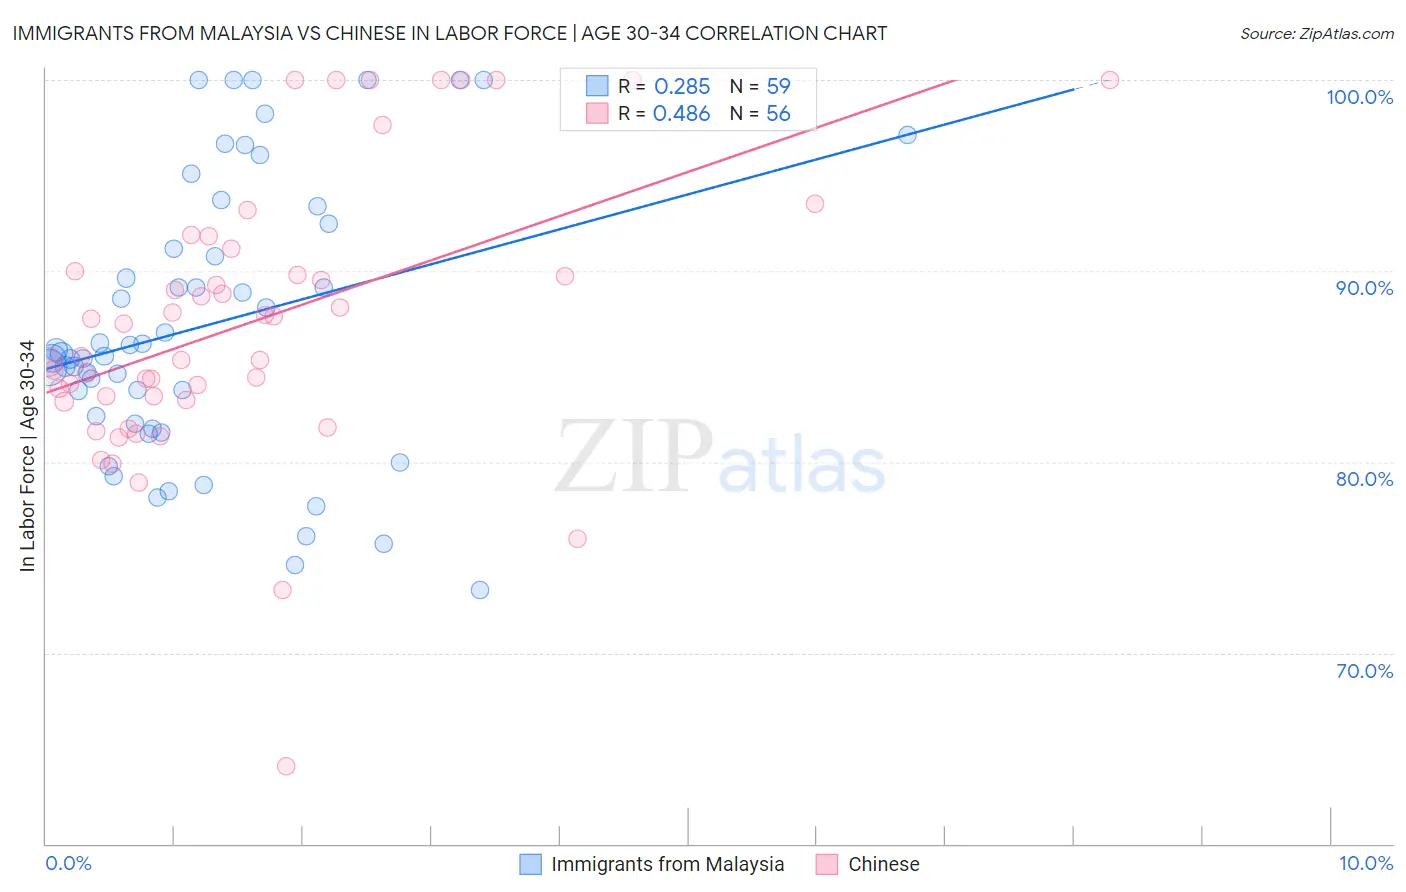
Immigrants from Malaysia vs Chinese In Labor Force | Age 30-34 Correlation Chart
The statistical analysis conducted on geographies consisting of 197,947,649 people shows a weak positive correlation between the proportion of Immigrants from Malaysia and labor force participation rate among population between the ages 30 and 34 in the United States with a correlation coefficient (R) of 0.285 and weighted average of 85.1%. Similarly, the statistical analysis conducted on geographies consisting of 64,801,795 people shows a moderate positive correlation between the proportion of Chinese and labor force participation rate among population between the ages 30 and 34 in the United States with a correlation coefficient (R) of 0.486 and weighted average of 85.0%, a difference of 0.11%.
In Labor Force | Age 30-34 Correlation Summary
| Measurement | Immigrants from Malaysia | Chinese |
| Minimum | 73.3% | 64.1% |
| Maximum | 100.0% | 100.0% |
| Range | 26.7% | 35.9% |
| Mean | 87.2% | 87.3% |
| Median | 85.7% | 86.4% |
| Interquartile 25% (IQ1) | 82.0% | 83.3% |
| Interquartile 75% (IQ3) | 92.5% | 90.6% |
| Interquartile Range (IQR) | 10.5% | 7.3% |
| Standard Deviation (Sample) | 7.2% | 7.3% |
| Standard Deviation (Population) | 7.1% | 7.3% |
Demographics Similar to Immigrants from Malaysia and Chinese by In Labor Force | Age 30-34
In terms of in labor force | age 30-34, the demographic groups most similar to Immigrants from Malaysia are Immigrants from Denmark (85.1%, a difference of 0.0%), Yugoslavian (85.1%, a difference of 0.010%), Immigrants from South Central Asia (85.1%, a difference of 0.010%), Egyptian (85.1%, a difference of 0.010%), and Asian (85.1%, a difference of 0.020%). Similarly, the demographic groups most similar to Chinese are Immigrants from Israel (85.0%, a difference of 0.0%), New Zealander (85.0%, a difference of 0.0%), Immigrants from Western Africa (85.0%, a difference of 0.010%), Immigrants from Spain (85.0%, a difference of 0.010%), and Immigrants from Chile (85.0%, a difference of 0.010%).
| Demographics | Rating | Rank | In Labor Force | Age 30-34 |
| Yugoslavians | 94.7 /100 | #114 | Exceptional 85.1% |
| Immigrants | South Central Asia | 94.6 /100 | #115 | Exceptional 85.1% |
| Egyptians | 94.5 /100 | #116 | Exceptional 85.1% |
| Immigrants | Denmark | 94.3 /100 | #117 | Exceptional 85.1% |
| Immigrants | Malaysia | 94.2 /100 | #118 | Exceptional 85.1% |
| Asians | 93.4 /100 | #119 | Exceptional 85.1% |
| Immigrants | Southern Europe | 93.3 /100 | #120 | Exceptional 85.1% |
| Immigrants | Egypt | 93.2 /100 | #121 | Exceptional 85.1% |
| Immigrants | Kuwait | 92.6 /100 | #122 | Exceptional 85.1% |
| Armenians | 92.2 /100 | #123 | Exceptional 85.0% |
| Australians | 92.0 /100 | #124 | Exceptional 85.0% |
| Immigrants | Jordan | 91.5 /100 | #125 | Exceptional 85.0% |
| Austrians | 90.9 /100 | #126 | Exceptional 85.0% |
| Slavs | 90.7 /100 | #127 | Exceptional 85.0% |
| Immigrants | Argentina | 90.6 /100 | #128 | Exceptional 85.0% |
| Immigrants | Western Africa | 90.2 /100 | #129 | Exceptional 85.0% |
| Immigrants | Spain | 90.0 /100 | #130 | Exceptional 85.0% |
| Chinese | 89.6 /100 | #131 | Excellent 85.0% |
| Immigrants | Israel | 89.5 /100 | #132 | Excellent 85.0% |
| New Zealanders | 89.5 /100 | #133 | Excellent 85.0% |
| Immigrants | Chile | 89.2 /100 | #134 | Excellent 85.0% |