Immigrants from Caribbean vs Sudanese In Labor Force | Age 30-34
COMPARE
Immigrants from Caribbean
Sudanese
In Labor Force | Age 30-34
In Labor Force | Age 30-34 Comparison
Immigrants from Caribbean
Sudanese
84.0%
IN LABOR FORCE | AGE 30-34
1.1/ 100
METRIC RATING
243rd/ 347
METRIC RANK
85.2%
IN LABOR FORCE | AGE 30-34
97.1/ 100
METRIC RATING
100th/ 347
METRIC RANK
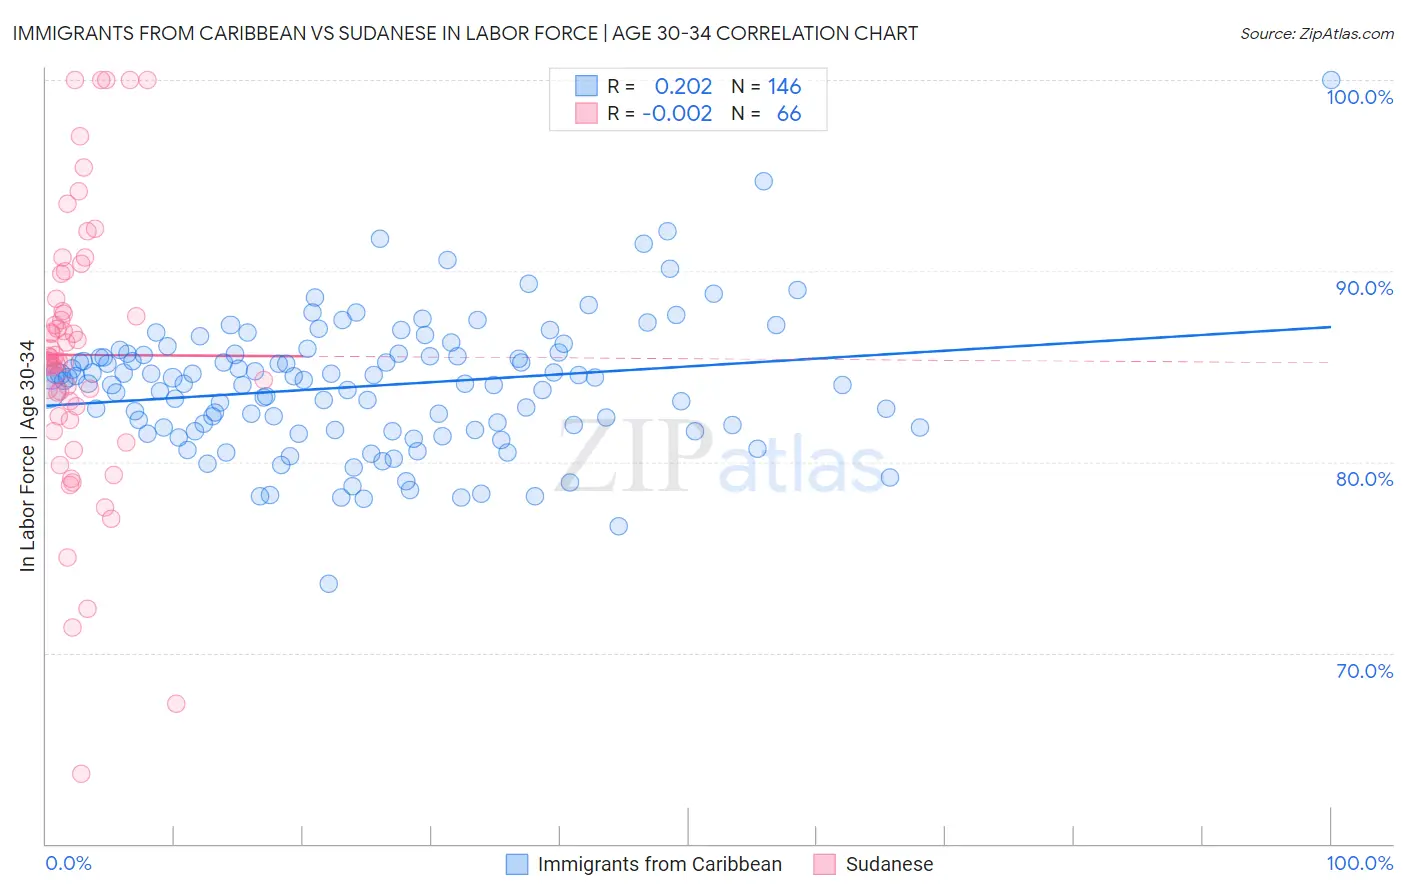
Immigrants from Caribbean vs Sudanese In Labor Force | Age 30-34 Correlation Chart
The statistical analysis conducted on geographies consisting of 449,684,451 people shows a weak positive correlation between the proportion of Immigrants from Caribbean and labor force participation rate among population between the ages 30 and 34 in the United States with a correlation coefficient (R) of 0.202 and weighted average of 84.0%. Similarly, the statistical analysis conducted on geographies consisting of 110,111,574 people shows no correlation between the proportion of Sudanese and labor force participation rate among population between the ages 30 and 34 in the United States with a correlation coefficient (R) of -0.002 and weighted average of 85.2%, a difference of 1.4%.
In Labor Force | Age 30-34 Correlation Summary
| Measurement | Immigrants from Caribbean | Sudanese |
| Minimum | 73.6% | 63.7% |
| Maximum | 100.0% | 100.0% |
| Range | 26.4% | 36.3% |
| Mean | 84.0% | 85.6% |
| Median | 84.2% | 85.4% |
| Interquartile 25% (IQ1) | 81.6% | 82.4% |
| Interquartile 75% (IQ3) | 85.6% | 88.5% |
| Interquartile Range (IQR) | 4.0% | 6.1% |
| Standard Deviation (Sample) | 3.5% | 7.2% |
| Standard Deviation (Population) | 3.5% | 7.2% |
Similar Demographics by In Labor Force | Age 30-34
Demographics Similar to Immigrants from Caribbean by In Labor Force | Age 30-34
In terms of in labor force | age 30-34, the demographic groups most similar to Immigrants from Caribbean are Immigrants from Oceania (84.0%, a difference of 0.010%), Immigrants from Portugal (84.0%, a difference of 0.020%), Basque (84.0%, a difference of 0.030%), Immigrants from Venezuela (84.0%, a difference of 0.030%), and Central American (84.0%, a difference of 0.030%).
| Demographics | Rating | Rank | In Labor Force | Age 30-34 |
| U.S. Virgin Islanders | 1.5 /100 | #236 | Tragic 84.1% |
| Celtics | 1.4 /100 | #237 | Tragic 84.1% |
| Immigrants | Barbados | 1.4 /100 | #238 | Tragic 84.0% |
| English | 1.4 /100 | #239 | Tragic 84.0% |
| Venezuelans | 1.3 /100 | #240 | Tragic 84.0% |
| Immigrants | Portugal | 1.2 /100 | #241 | Tragic 84.0% |
| Immigrants | Oceania | 1.1 /100 | #242 | Tragic 84.0% |
| Immigrants | Caribbean | 1.1 /100 | #243 | Tragic 84.0% |
| Basques | 0.9 /100 | #244 | Tragic 84.0% |
| Immigrants | Venezuela | 0.9 /100 | #245 | Tragic 84.0% |
| Central Americans | 0.9 /100 | #246 | Tragic 84.0% |
| British West Indians | 0.8 /100 | #247 | Tragic 84.0% |
| Portuguese | 0.8 /100 | #248 | Tragic 84.0% |
| Immigrants | Dominica | 0.7 /100 | #249 | Tragic 84.0% |
| Immigrants | Iraq | 0.7 /100 | #250 | Tragic 83.9% |
Demographics Similar to Sudanese by In Labor Force | Age 30-34
In terms of in labor force | age 30-34, the demographic groups most similar to Sudanese are Belgian (85.2%, a difference of 0.0%), Immigrants from Korea (85.2%, a difference of 0.010%), Thai (85.2%, a difference of 0.010%), Immigrants from Uganda (85.2%, a difference of 0.010%), and Immigrants from Belarus (85.2%, a difference of 0.010%).
| Demographics | Rating | Rank | In Labor Force | Age 30-34 |
| Immigrants | Norway | 97.6 /100 | #93 | Exceptional 85.2% |
| Swedes | 97.5 /100 | #94 | Exceptional 85.2% |
| Immigrants | India | 97.4 /100 | #95 | Exceptional 85.2% |
| Immigrants | Korea | 97.3 /100 | #96 | Exceptional 85.2% |
| Thais | 97.2 /100 | #97 | Exceptional 85.2% |
| Immigrants | Uganda | 97.2 /100 | #98 | Exceptional 85.2% |
| Belgians | 97.2 /100 | #99 | Exceptional 85.2% |
| Sudanese | 97.1 /100 | #100 | Exceptional 85.2% |
| Immigrants | Belarus | 96.9 /100 | #101 | Exceptional 85.2% |
| Immigrants | Austria | 96.8 /100 | #102 | Exceptional 85.2% |
| Ukrainians | 96.6 /100 | #103 | Exceptional 85.2% |
| Immigrants | Ghana | 96.5 /100 | #104 | Exceptional 85.2% |
| Alsatians | 96.3 /100 | #105 | Exceptional 85.2% |
| Immigrants | Middle Africa | 96.3 /100 | #106 | Exceptional 85.2% |
| Immigrants | Northern Africa | 96.3 /100 | #107 | Exceptional 85.2% |