Immigrants from Canada vs Immigrants from Brazil Unemployment Among Ages 65 to 74 years
COMPARE
Immigrants from Canada
Immigrants from Brazil
Unemployment Among Ages 65 to 74 years
Unemployment Among Ages 65 to 74 years Comparison
Immigrants from Canada
Immigrants from Brazil
5.3%
UNEMPLOYMENT AMONG AGES 65 TO 74 YEARS
89.0/ 100
METRIC RATING
122nd/ 347
METRIC RANK
5.6%
UNEMPLOYMENT AMONG AGES 65 TO 74 YEARS
0.5/ 100
METRIC RATING
253rd/ 347
METRIC RANK
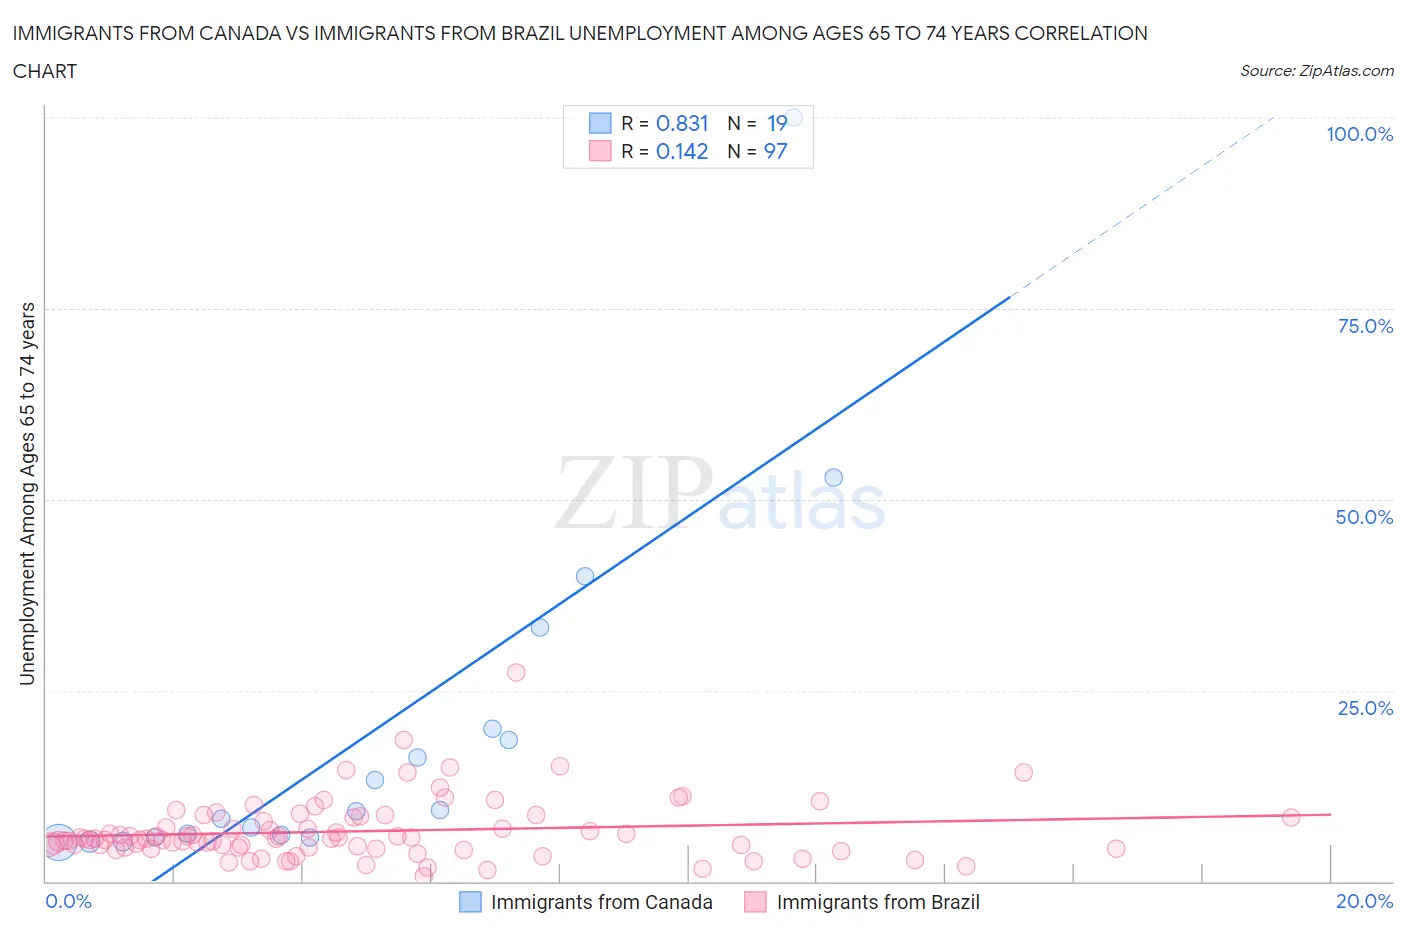
Immigrants from Canada vs Immigrants from Brazil Unemployment Among Ages 65 to 74 years Correlation Chart
The statistical analysis conducted on geographies consisting of 390,796,891 people shows a very strong positive correlation between the proportion of Immigrants from Canada and unemployment rate among population between the ages 65 and 74 in the United States with a correlation coefficient (R) of 0.831 and weighted average of 5.3%. Similarly, the statistical analysis conducted on geographies consisting of 309,749,497 people shows a poor positive correlation between the proportion of Immigrants from Brazil and unemployment rate among population between the ages 65 and 74 in the United States with a correlation coefficient (R) of 0.142 and weighted average of 5.6%, a difference of 6.3%.
Unemployment Among Ages 65 to 74 years Correlation Summary
| Measurement | Immigrants from Canada | Immigrants from Brazil |
| Minimum | 5.1% | 0.70% |
| Maximum | 100.0% | 27.4% |
| Range | 94.9% | 26.7% |
| Mean | 19.3% | 6.5% |
| Median | 9.1% | 5.6% |
| Interquartile 25% (IQ1) | 5.8% | 4.4% |
| Interquartile 75% (IQ3) | 20.0% | 8.4% |
| Interquartile Range (IQR) | 14.2% | 4.0% |
| Standard Deviation (Sample) | 23.7% | 4.0% |
| Standard Deviation (Population) | 23.1% | 3.9% |
Similar Demographics by Unemployment Among Ages 65 to 74 years
Demographics Similar to Immigrants from Canada by Unemployment Among Ages 65 to 74 years
In terms of unemployment among ages 65 to 74 years, the demographic groups most similar to Immigrants from Canada are Immigrants from Australia (5.3%, a difference of 0.010%), Czechoslovakian (5.3%, a difference of 0.040%), Immigrants from Fiji (5.3%, a difference of 0.080%), Immigrants from Switzerland (5.3%, a difference of 0.080%), and Immigrants from Belarus (5.3%, a difference of 0.10%).
| Demographics | Rating | Rank | Unemployment Among Ages 65 to 74 years |
| Immigrants | Turkey | 90.8 /100 | #115 | Exceptional 5.3% |
| Australians | 90.4 /100 | #116 | Exceptional 5.3% |
| Immigrants | Korea | 90.2 /100 | #117 | Exceptional 5.3% |
| Immigrants | Belarus | 90.1 /100 | #118 | Exceptional 5.3% |
| Immigrants | Fiji | 89.9 /100 | #119 | Excellent 5.3% |
| Immigrants | Switzerland | 89.9 /100 | #120 | Excellent 5.3% |
| Immigrants | Australia | 89.1 /100 | #121 | Excellent 5.3% |
| Immigrants | Canada | 89.0 /100 | #122 | Excellent 5.3% |
| Czechoslovakians | 88.6 /100 | #123 | Excellent 5.3% |
| Immigrants | Ukraine | 87.5 /100 | #124 | Excellent 5.3% |
| Pakistanis | 87.5 /100 | #125 | Excellent 5.3% |
| Immigrants | South Eastern Asia | 87.2 /100 | #126 | Excellent 5.3% |
| Immigrants | North America | 86.7 /100 | #127 | Excellent 5.3% |
| Immigrants | Hong Kong | 86.5 /100 | #128 | Excellent 5.3% |
| Immigrants | England | 86.2 /100 | #129 | Excellent 5.3% |
Demographics Similar to Immigrants from Brazil by Unemployment Among Ages 65 to 74 years
In terms of unemployment among ages 65 to 74 years, the demographic groups most similar to Immigrants from Brazil are Immigrants from Costa Rica (5.6%, a difference of 0.020%), Colombian (5.6%, a difference of 0.060%), Brazilian (5.6%, a difference of 0.10%), Immigrants from Haiti (5.6%, a difference of 0.11%), and Native Hawaiian (5.6%, a difference of 0.21%).
| Demographics | Rating | Rank | Unemployment Among Ages 65 to 74 years |
| Paraguayans | 0.9 /100 | #246 | Tragic 5.6% |
| Immigrants | Immigrants | 0.9 /100 | #247 | Tragic 5.6% |
| Immigrants | Argentina | 0.9 /100 | #248 | Tragic 5.6% |
| Trinidadians and Tobagonians | 0.8 /100 | #249 | Tragic 5.6% |
| Cape Verdeans | 0.7 /100 | #250 | Tragic 5.6% |
| Brazilians | 0.5 /100 | #251 | Tragic 5.6% |
| Colombians | 0.5 /100 | #252 | Tragic 5.6% |
| Immigrants | Brazil | 0.5 /100 | #253 | Tragic 5.6% |
| Immigrants | Costa Rica | 0.5 /100 | #254 | Tragic 5.6% |
| Immigrants | Haiti | 0.4 /100 | #255 | Tragic 5.6% |
| Native Hawaiians | 0.4 /100 | #256 | Tragic 5.6% |
| Immigrants | Southern Europe | 0.3 /100 | #257 | Tragic 5.6% |
| Immigrants | Western Africa | 0.3 /100 | #258 | Tragic 5.6% |
| Sierra Leoneans | 0.2 /100 | #259 | Tragic 5.6% |
| Immigrants | Barbados | 0.2 /100 | #260 | Tragic 5.6% |