South American Indian vs Thai In Labor Force | Age 16-19
COMPARE
South American Indian
Thai
In Labor Force | Age 16-19
In Labor Force | Age 16-19 Comparison
South American Indians
Thais
35.8%
IN LABOR FORCE | AGE 16-19
14.6/ 100
METRIC RATING
205th/ 347
METRIC RANK
34.6%
IN LABOR FORCE | AGE 16-19
1.2/ 100
METRIC RATING
258th/ 347
METRIC RANK
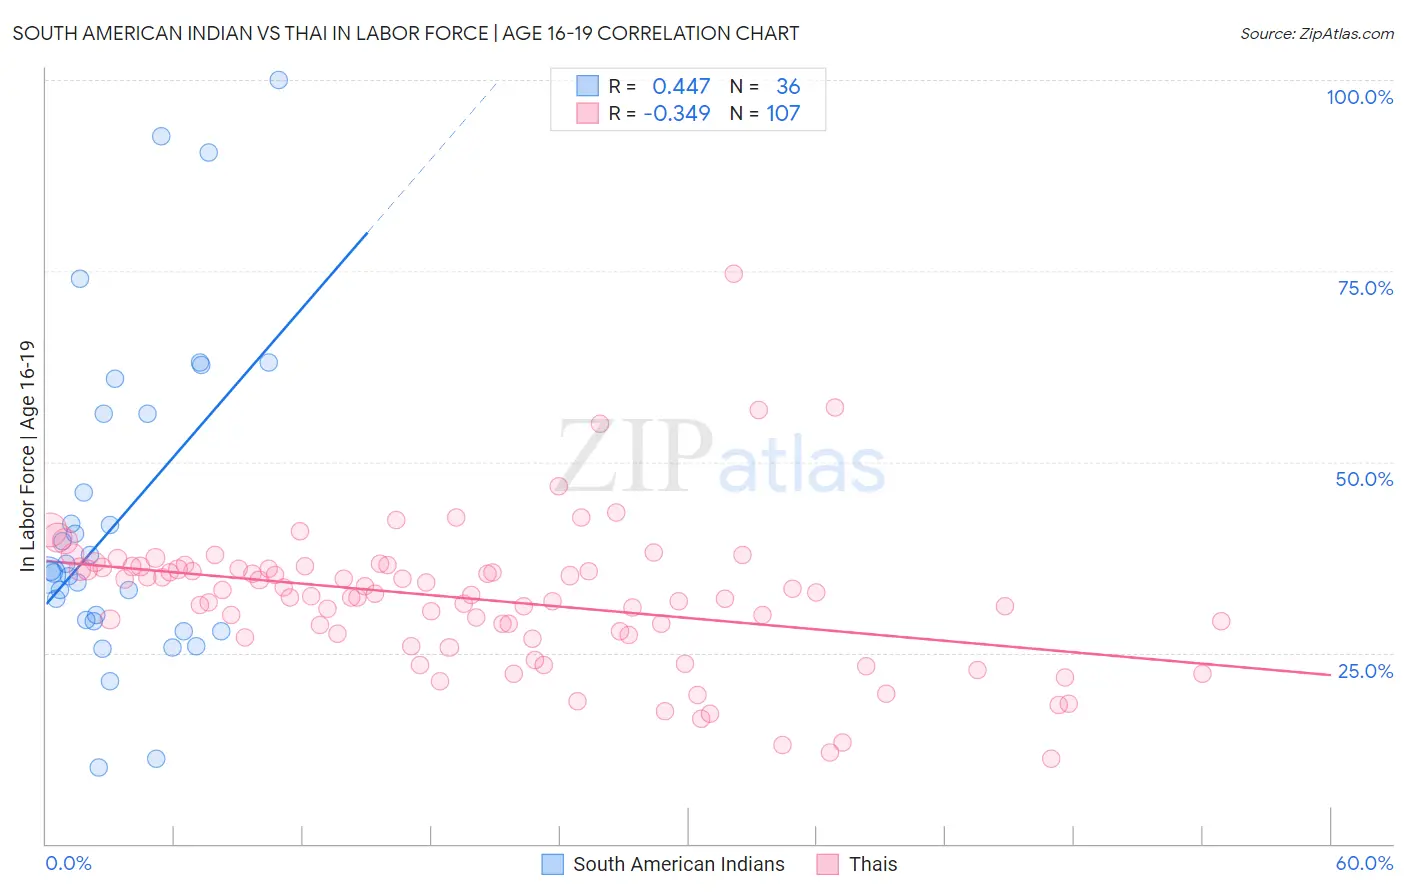
South American Indian vs Thai In Labor Force | Age 16-19 Correlation Chart
The statistical analysis conducted on geographies consisting of 164,452,175 people shows a moderate positive correlation between the proportion of South American Indians and labor force participation rate among population between the ages 16 and 19 in the United States with a correlation coefficient (R) of 0.447 and weighted average of 35.8%. Similarly, the statistical analysis conducted on geographies consisting of 474,909,482 people shows a mild negative correlation between the proportion of Thais and labor force participation rate among population between the ages 16 and 19 in the United States with a correlation coefficient (R) of -0.349 and weighted average of 34.6%, a difference of 3.5%.
In Labor Force | Age 16-19 Correlation Summary
| Measurement | South American Indian | Thai |
| Minimum | 10.0% | 11.1% |
| Maximum | 100.0% | 74.6% |
| Range | 90.0% | 63.5% |
| Mean | 42.8% | 32.0% |
| Median | 35.6% | 32.6% |
| Interquartile 25% (IQ1) | 29.3% | 27.3% |
| Interquartile 75% (IQ3) | 56.3% | 36.2% |
| Interquartile Range (IQR) | 27.0% | 9.0% |
| Standard Deviation (Sample) | 21.4% | 9.4% |
| Standard Deviation (Population) | 21.1% | 9.4% |
Similar Demographics by In Labor Force | Age 16-19
Demographics Similar to South American Indians by In Labor Force | Age 16-19
In terms of in labor force | age 16-19, the demographic groups most similar to South American Indians are Chilean (35.8%, a difference of 0.0%), Immigrants from Eastern Europe (35.8%, a difference of 0.020%), Immigrants from Albania (35.8%, a difference of 0.040%), Korean (35.7%, a difference of 0.14%), and Immigrants from Nigeria (35.8%, a difference of 0.21%).
| Demographics | Rating | Rank | In Labor Force | Age 16-19 |
| Immigrants | Northern Africa | 19.9 /100 | #198 | Poor 35.9% |
| Immigrants | Norway | 19.8 /100 | #199 | Poor 35.9% |
| Immigrants | Sweden | 18.8 /100 | #200 | Poor 35.9% |
| Alsatians | 17.5 /100 | #201 | Poor 35.9% |
| Senegalese | 17.4 /100 | #202 | Poor 35.9% |
| Immigrants | Nigeria | 16.8 /100 | #203 | Poor 35.8% |
| Immigrants | Albania | 15.0 /100 | #204 | Poor 35.8% |
| South American Indians | 14.6 /100 | #205 | Poor 35.8% |
| Chileans | 14.6 /100 | #206 | Poor 35.8% |
| Immigrants | Eastern Europe | 14.5 /100 | #207 | Poor 35.8% |
| Koreans | 13.3 /100 | #208 | Poor 35.7% |
| Moroccans | 12.7 /100 | #209 | Poor 35.7% |
| Immigrants | Switzerland | 11.9 /100 | #210 | Poor 35.6% |
| Mexicans | 11.9 /100 | #211 | Poor 35.6% |
| Houma | 11.0 /100 | #212 | Poor 35.6% |
Demographics Similar to Thais by In Labor Force | Age 16-19
In terms of in labor force | age 16-19, the demographic groups most similar to Thais are Immigrants from South Central Asia (34.6%, a difference of 0.010%), Immigrants from Egypt (34.6%, a difference of 0.010%), Immigrants (34.6%, a difference of 0.020%), Egyptian (34.5%, a difference of 0.10%), and Peruvian (34.6%, a difference of 0.12%).
| Demographics | Rating | Rank | In Labor Force | Age 16-19 |
| Immigrants | Western Asia | 2.0 /100 | #251 | Tragic 34.8% |
| Immigrants | Chile | 2.0 /100 | #252 | Tragic 34.8% |
| Immigrants | Japan | 1.5 /100 | #253 | Tragic 34.7% |
| Bahamians | 1.4 /100 | #254 | Tragic 34.6% |
| Peruvians | 1.4 /100 | #255 | Tragic 34.6% |
| Immigrants | South Central Asia | 1.3 /100 | #256 | Tragic 34.6% |
| Immigrants | Egypt | 1.2 /100 | #257 | Tragic 34.6% |
| Thais | 1.2 /100 | #258 | Tragic 34.6% |
| Immigrants | Immigrants | 1.2 /100 | #259 | Tragic 34.6% |
| Egyptians | 1.2 /100 | #260 | Tragic 34.5% |
| Salvadorans | 1.1 /100 | #261 | Tragic 34.5% |
| Hispanics or Latinos | 1.1 /100 | #262 | Tragic 34.5% |
| Burmese | 1.1 /100 | #263 | Tragic 34.5% |
| Immigrants | Uruguay | 0.9 /100 | #264 | Tragic 34.4% |
| Immigrants | El Salvador | 0.7 /100 | #265 | Tragic 34.3% |