Immigrants from Burma/Myanmar vs Italian In Labor Force | Age 16-19
COMPARE
Immigrants from Burma/Myanmar
Italian
In Labor Force | Age 16-19
In Labor Force | Age 16-19 Comparison
Immigrants from Burma/Myanmar
Italians
39.0%
IN LABOR FORCE | AGE 16-19
99.5/ 100
METRIC RATING
90th/ 347
METRIC RANK
40.1%
IN LABOR FORCE | AGE 16-19
99.9/ 100
METRIC RATING
68th/ 347
METRIC RANK
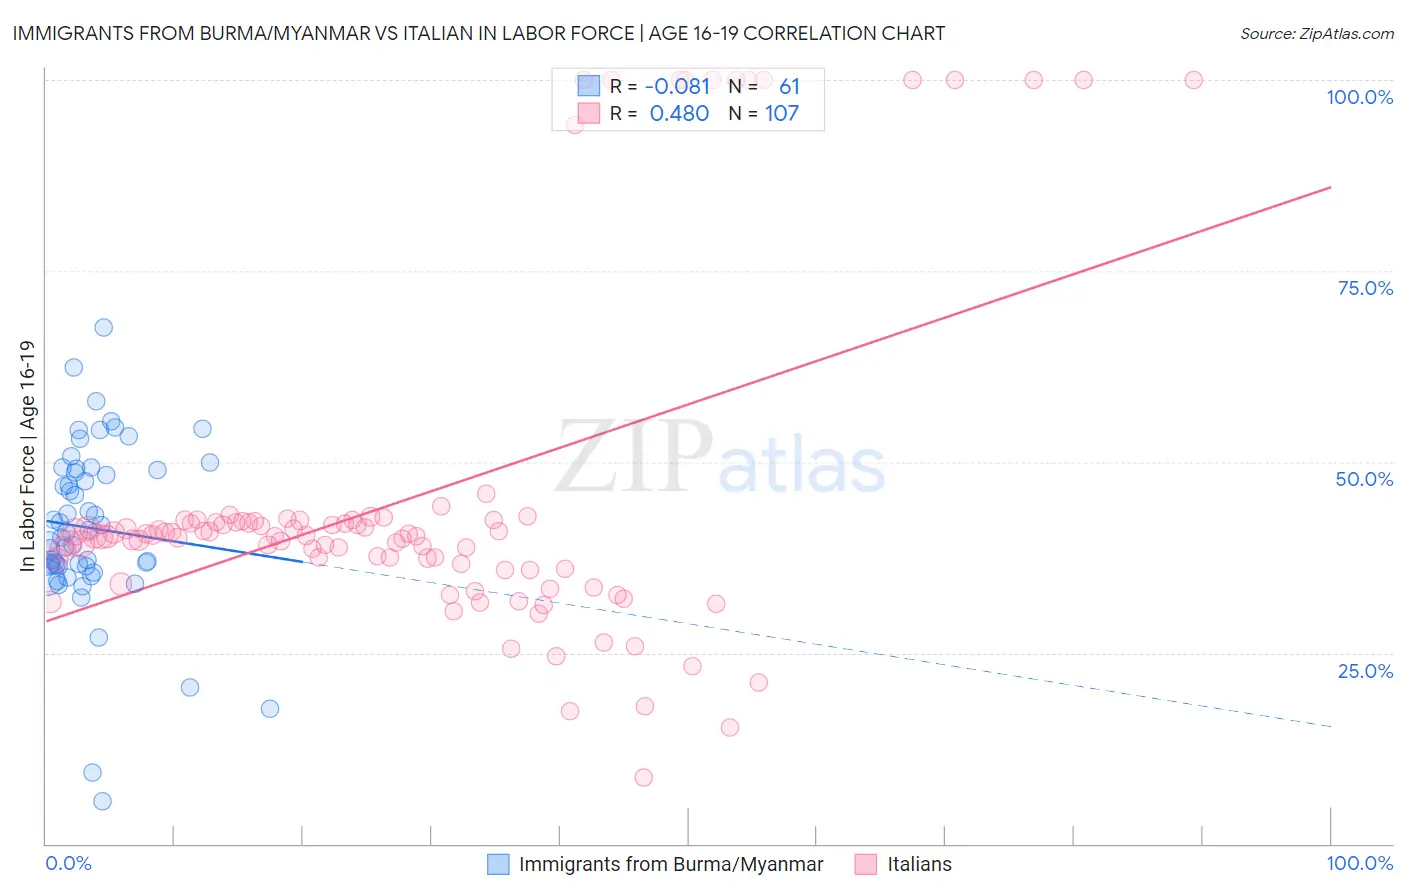
Immigrants from Burma/Myanmar vs Italian In Labor Force | Age 16-19 Correlation Chart
The statistical analysis conducted on geographies consisting of 172,320,097 people shows a slight negative correlation between the proportion of Immigrants from Burma/Myanmar and labor force participation rate among population between the ages 16 and 19 in the United States with a correlation coefficient (R) of -0.081 and weighted average of 39.0%. Similarly, the statistical analysis conducted on geographies consisting of 570,596,297 people shows a moderate positive correlation between the proportion of Italians and labor force participation rate among population between the ages 16 and 19 in the United States with a correlation coefficient (R) of 0.480 and weighted average of 40.1%, a difference of 2.6%.
In Labor Force | Age 16-19 Correlation Summary
| Measurement | Immigrants from Burma/Myanmar | Italian |
| Minimum | 5.6% | 8.6% |
| Maximum | 67.6% | 100.0% |
| Range | 62.0% | 91.4% |
| Mean | 41.3% | 45.2% |
| Median | 40.7% | 40.3% |
| Interquartile 25% (IQ1) | 36.3% | 36.1% |
| Interquartile 75% (IQ3) | 49.0% | 42.3% |
| Interquartile Range (IQR) | 12.7% | 6.2% |
| Standard Deviation (Sample) | 11.1% | 22.2% |
| Standard Deviation (Population) | 11.0% | 22.1% |
Similar Demographics by In Labor Force | Age 16-19
Demographics Similar to Immigrants from Burma/Myanmar by In Labor Force | Age 16-19
In terms of in labor force | age 16-19, the demographic groups most similar to Immigrants from Burma/Myanmar are Alaska Native (39.1%, a difference of 0.080%), Puget Sound Salish (39.1%, a difference of 0.090%), Spanish American (39.0%, a difference of 0.15%), Immigrants from Germany (39.1%, a difference of 0.16%), and Osage (39.0%, a difference of 0.23%).
| Demographics | Rating | Rank | In Labor Force | Age 16-19 |
| Spanish | 99.7 /100 | #83 | Exceptional 39.3% |
| Immigrants | Uganda | 99.7 /100 | #84 | Exceptional 39.2% |
| Creek | 99.6 /100 | #85 | Exceptional 39.1% |
| Samoans | 99.6 /100 | #86 | Exceptional 39.1% |
| Immigrants | Germany | 99.6 /100 | #87 | Exceptional 39.1% |
| Puget Sound Salish | 99.6 /100 | #88 | Exceptional 39.1% |
| Alaska Natives | 99.6 /100 | #89 | Exceptional 39.1% |
| Immigrants | Burma/Myanmar | 99.5 /100 | #90 | Exceptional 39.0% |
| Spanish Americans | 99.5 /100 | #91 | Exceptional 39.0% |
| Osage | 99.4 /100 | #92 | Exceptional 39.0% |
| Blackfeet | 99.4 /100 | #93 | Exceptional 38.9% |
| Immigrants | Canada | 99.4 /100 | #94 | Exceptional 38.9% |
| Immigrants | North America | 99.4 /100 | #95 | Exceptional 38.9% |
| Latvians | 99.4 /100 | #96 | Exceptional 38.9% |
| Greeks | 99.3 /100 | #97 | Exceptional 38.9% |
Demographics Similar to Italians by In Labor Force | Age 16-19
In terms of in labor force | age 16-19, the demographic groups most similar to Italians are Canadian (40.1%, a difference of 0.060%), Nonimmigrants (40.1%, a difference of 0.070%), Potawatomi (40.0%, a difference of 0.070%), Portuguese (40.0%, a difference of 0.12%), and Kenyan (40.1%, a difference of 0.19%).
| Demographics | Rating | Rank | In Labor Force | Age 16-19 |
| Americans | 100.0 /100 | #61 | Exceptional 40.3% |
| Cherokee | 100.0 /100 | #62 | Exceptional 40.2% |
| Northern Europeans | 100.0 /100 | #63 | Exceptional 40.2% |
| Immigrants | Micronesia | 100.0 /100 | #64 | Exceptional 40.2% |
| Kenyans | 100.0 /100 | #65 | Exceptional 40.1% |
| Immigrants | Nonimmigrants | 100.0 /100 | #66 | Exceptional 40.1% |
| Canadians | 100.0 /100 | #67 | Exceptional 40.1% |
| Italians | 99.9 /100 | #68 | Exceptional 40.1% |
| Potawatomi | 99.9 /100 | #69 | Exceptional 40.0% |
| Portuguese | 99.9 /100 | #70 | Exceptional 40.0% |
| Serbians | 99.9 /100 | #71 | Exceptional 39.9% |
| Iroquois | 99.9 /100 | #72 | Exceptional 39.9% |
| Immigrants | Middle Africa | 99.9 /100 | #73 | Exceptional 39.9% |
| Hungarians | 99.9 /100 | #74 | Exceptional 39.8% |
| French American Indians | 99.9 /100 | #75 | Exceptional 39.8% |