Immigrants from Burma/Myanmar vs Immigrants from Laos In Labor Force | Age 16-19
COMPARE
Immigrants from Burma/Myanmar
Immigrants from Laos
In Labor Force | Age 16-19
In Labor Force | Age 16-19 Comparison
Immigrants from Burma/Myanmar
Immigrants from Laos
39.0%
IN LABOR FORCE | AGE 16-19
99.5/ 100
METRIC RATING
90th/ 347
METRIC RANK
40.6%
IN LABOR FORCE | AGE 16-19
100.0/ 100
METRIC RATING
52nd/ 347
METRIC RANK
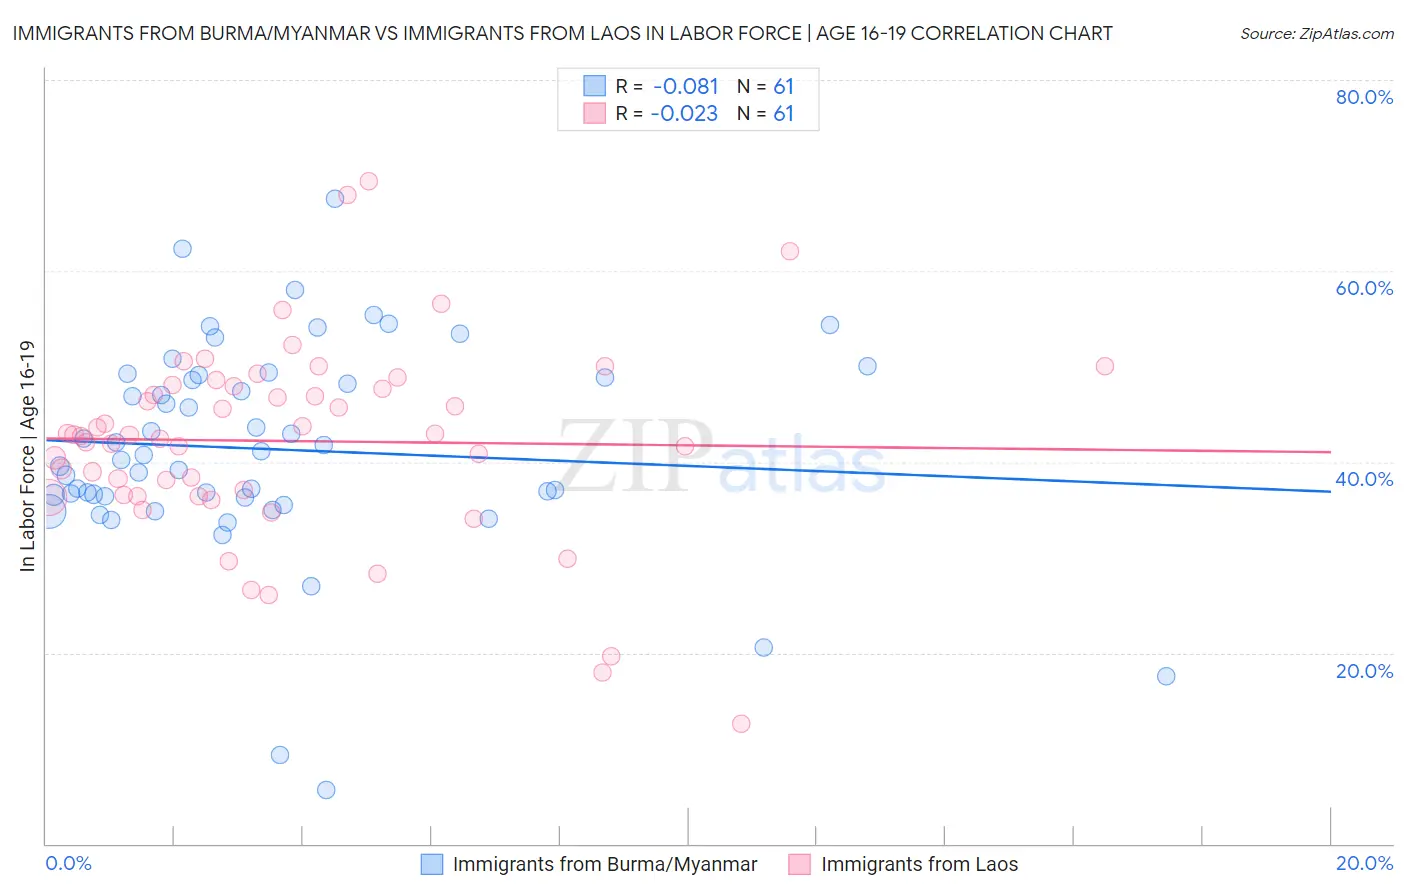
Immigrants from Burma/Myanmar vs Immigrants from Laos In Labor Force | Age 16-19 Correlation Chart
The statistical analysis conducted on geographies consisting of 172,320,097 people shows a slight negative correlation between the proportion of Immigrants from Burma/Myanmar and labor force participation rate among population between the ages 16 and 19 in the United States with a correlation coefficient (R) of -0.081 and weighted average of 39.0%. Similarly, the statistical analysis conducted on geographies consisting of 201,366,524 people shows no correlation between the proportion of Immigrants from Laos and labor force participation rate among population between the ages 16 and 19 in the United States with a correlation coefficient (R) of -0.023 and weighted average of 40.6%, a difference of 4.1%.
In Labor Force | Age 16-19 Correlation Summary
| Measurement | Immigrants from Burma/Myanmar | Immigrants from Laos |
| Minimum | 5.6% | 12.6% |
| Maximum | 67.6% | 69.4% |
| Range | 62.0% | 56.8% |
| Mean | 41.3% | 42.2% |
| Median | 40.7% | 42.8% |
| Interquartile 25% (IQ1) | 36.3% | 36.5% |
| Interquartile 75% (IQ3) | 49.0% | 48.0% |
| Interquartile Range (IQR) | 12.7% | 11.5% |
| Standard Deviation (Sample) | 11.1% | 10.3% |
| Standard Deviation (Population) | 11.0% | 10.3% |
Similar Demographics by In Labor Force | Age 16-19
Demographics Similar to Immigrants from Burma/Myanmar by In Labor Force | Age 16-19
In terms of in labor force | age 16-19, the demographic groups most similar to Immigrants from Burma/Myanmar are Alaska Native (39.1%, a difference of 0.080%), Puget Sound Salish (39.1%, a difference of 0.090%), Spanish American (39.0%, a difference of 0.15%), Immigrants from Germany (39.1%, a difference of 0.16%), and Osage (39.0%, a difference of 0.23%).
| Demographics | Rating | Rank | In Labor Force | Age 16-19 |
| Spanish | 99.7 /100 | #83 | Exceptional 39.3% |
| Immigrants | Uganda | 99.7 /100 | #84 | Exceptional 39.2% |
| Creek | 99.6 /100 | #85 | Exceptional 39.1% |
| Samoans | 99.6 /100 | #86 | Exceptional 39.1% |
| Immigrants | Germany | 99.6 /100 | #87 | Exceptional 39.1% |
| Puget Sound Salish | 99.6 /100 | #88 | Exceptional 39.1% |
| Alaska Natives | 99.6 /100 | #89 | Exceptional 39.1% |
| Immigrants | Burma/Myanmar | 99.5 /100 | #90 | Exceptional 39.0% |
| Spanish Americans | 99.5 /100 | #91 | Exceptional 39.0% |
| Osage | 99.4 /100 | #92 | Exceptional 39.0% |
| Blackfeet | 99.4 /100 | #93 | Exceptional 38.9% |
| Immigrants | Canada | 99.4 /100 | #94 | Exceptional 38.9% |
| Immigrants | North America | 99.4 /100 | #95 | Exceptional 38.9% |
| Latvians | 99.4 /100 | #96 | Exceptional 38.9% |
| Greeks | 99.3 /100 | #97 | Exceptional 38.9% |
Demographics Similar to Immigrants from Laos by In Labor Force | Age 16-19
In terms of in labor force | age 16-19, the demographic groups most similar to Immigrants from Laos are Immigrants from Zaire (40.7%, a difference of 0.090%), Indonesian (40.7%, a difference of 0.19%), Immigrants from Kenya (40.5%, a difference of 0.32%), Cree (40.8%, a difference of 0.34%), and Tlingit-Haida (40.5%, a difference of 0.35%).
| Demographics | Rating | Rank | In Labor Force | Age 16-19 |
| Croatians | 100.0 /100 | #45 | Exceptional 41.1% |
| Immigrants | Sudan | 100.0 /100 | #46 | Exceptional 41.0% |
| Carpatho Rusyns | 100.0 /100 | #47 | Exceptional 40.8% |
| Icelanders | 100.0 /100 | #48 | Exceptional 40.8% |
| Cree | 100.0 /100 | #49 | Exceptional 40.8% |
| Indonesians | 100.0 /100 | #50 | Exceptional 40.7% |
| Immigrants | Zaire | 100.0 /100 | #51 | Exceptional 40.7% |
| Immigrants | Laos | 100.0 /100 | #52 | Exceptional 40.6% |
| Immigrants | Kenya | 100.0 /100 | #53 | Exceptional 40.5% |
| Tlingit-Haida | 100.0 /100 | #54 | Exceptional 40.5% |
| British | 100.0 /100 | #55 | Exceptional 40.5% |
| Fijians | 100.0 /100 | #56 | Exceptional 40.4% |
| Lithuanians | 100.0 /100 | #57 | Exceptional 40.4% |
| Aleuts | 100.0 /100 | #58 | Exceptional 40.4% |
| Slavs | 100.0 /100 | #59 | Exceptional 40.4% |