Immigrants from Burma/Myanmar vs Immigrants from Dominican Republic In Labor Force | Age 16-19
COMPARE
Immigrants from Burma/Myanmar
Immigrants from Dominican Republic
In Labor Force | Age 16-19
In Labor Force | Age 16-19 Comparison
Immigrants from Burma/Myanmar
Immigrants from Dominican Republic
39.0%
IN LABOR FORCE | AGE 16-19
99.5/ 100
METRIC RATING
90th/ 347
METRIC RANK
31.1%
IN LABOR FORCE | AGE 16-19
0.0/ 100
METRIC RATING
326th/ 347
METRIC RANK
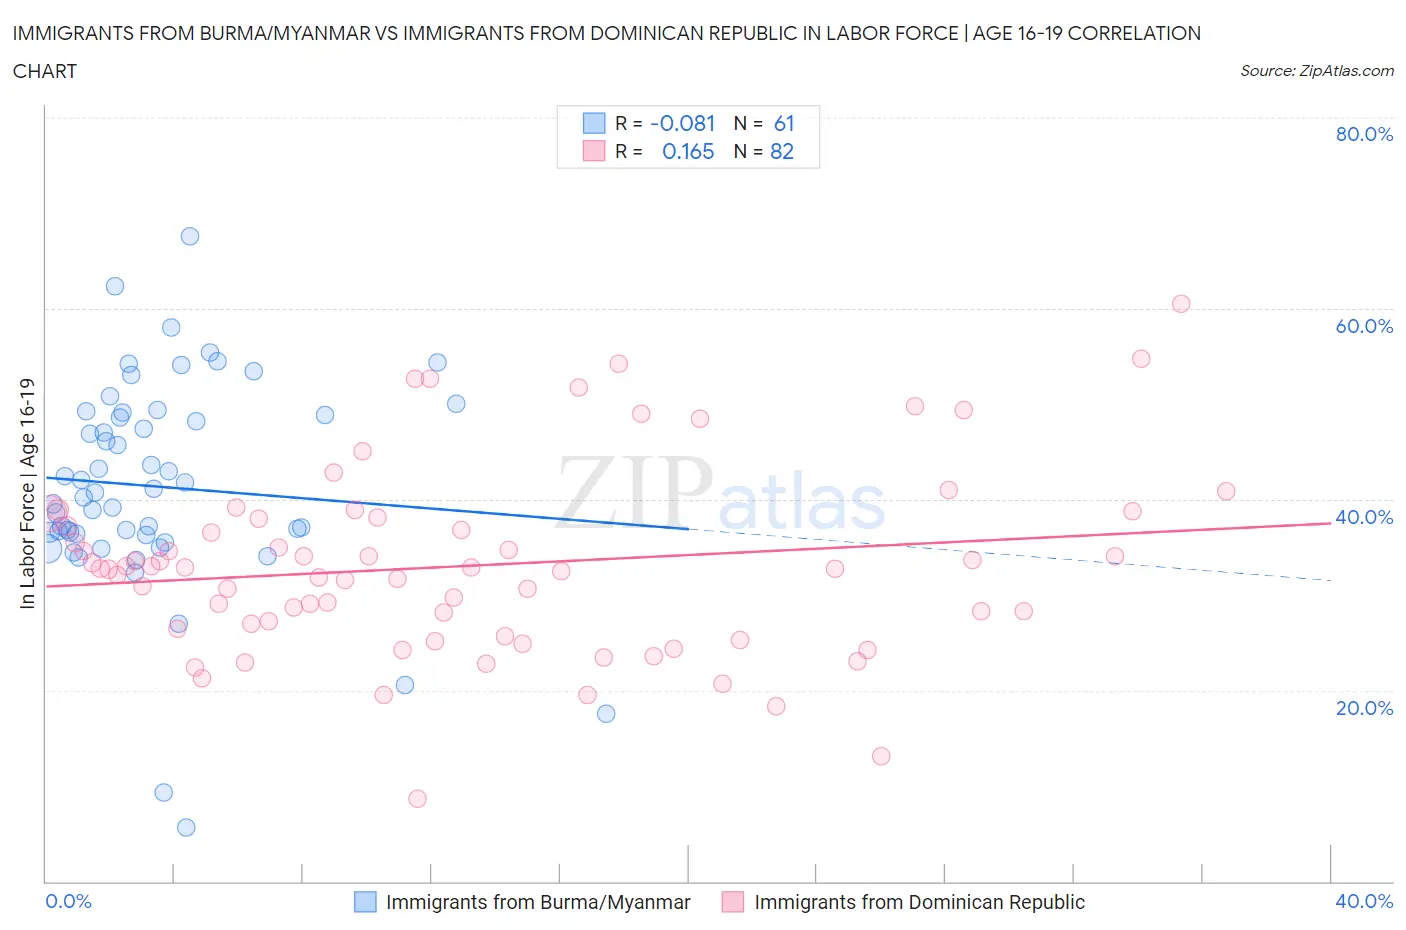
Immigrants from Burma/Myanmar vs Immigrants from Dominican Republic In Labor Force | Age 16-19 Correlation Chart
The statistical analysis conducted on geographies consisting of 172,320,097 people shows a slight negative correlation between the proportion of Immigrants from Burma/Myanmar and labor force participation rate among population between the ages 16 and 19 in the United States with a correlation coefficient (R) of -0.081 and weighted average of 39.0%. Similarly, the statistical analysis conducted on geographies consisting of 274,798,225 people shows a poor positive correlation between the proportion of Immigrants from Dominican Republic and labor force participation rate among population between the ages 16 and 19 in the United States with a correlation coefficient (R) of 0.165 and weighted average of 31.1%, a difference of 25.6%.
In Labor Force | Age 16-19 Correlation Summary
| Measurement | Immigrants from Burma/Myanmar | Immigrants from Dominican Republic |
| Minimum | 5.6% | 8.7% |
| Maximum | 67.6% | 60.5% |
| Range | 62.0% | 51.8% |
| Mean | 41.3% | 33.0% |
| Median | 40.7% | 32.7% |
| Interquartile 25% (IQ1) | 36.3% | 26.5% |
| Interquartile 75% (IQ3) | 49.0% | 38.0% |
| Interquartile Range (IQR) | 12.7% | 11.5% |
| Standard Deviation (Sample) | 11.1% | 9.7% |
| Standard Deviation (Population) | 11.0% | 9.7% |
Similar Demographics by In Labor Force | Age 16-19
Demographics Similar to Immigrants from Burma/Myanmar by In Labor Force | Age 16-19
In terms of in labor force | age 16-19, the demographic groups most similar to Immigrants from Burma/Myanmar are Alaska Native (39.1%, a difference of 0.080%), Puget Sound Salish (39.1%, a difference of 0.090%), Spanish American (39.0%, a difference of 0.15%), Immigrants from Germany (39.1%, a difference of 0.16%), and Osage (39.0%, a difference of 0.23%).
| Demographics | Rating | Rank | In Labor Force | Age 16-19 |
| Spanish | 99.7 /100 | #83 | Exceptional 39.3% |
| Immigrants | Uganda | 99.7 /100 | #84 | Exceptional 39.2% |
| Creek | 99.6 /100 | #85 | Exceptional 39.1% |
| Samoans | 99.6 /100 | #86 | Exceptional 39.1% |
| Immigrants | Germany | 99.6 /100 | #87 | Exceptional 39.1% |
| Puget Sound Salish | 99.6 /100 | #88 | Exceptional 39.1% |
| Alaska Natives | 99.6 /100 | #89 | Exceptional 39.1% |
| Immigrants | Burma/Myanmar | 99.5 /100 | #90 | Exceptional 39.0% |
| Spanish Americans | 99.5 /100 | #91 | Exceptional 39.0% |
| Osage | 99.4 /100 | #92 | Exceptional 39.0% |
| Blackfeet | 99.4 /100 | #93 | Exceptional 38.9% |
| Immigrants | Canada | 99.4 /100 | #94 | Exceptional 38.9% |
| Immigrants | North America | 99.4 /100 | #95 | Exceptional 38.9% |
| Latvians | 99.4 /100 | #96 | Exceptional 38.9% |
| Greeks | 99.3 /100 | #97 | Exceptional 38.9% |
Demographics Similar to Immigrants from Dominican Republic by In Labor Force | Age 16-19
In terms of in labor force | age 16-19, the demographic groups most similar to Immigrants from Dominican Republic are Immigrants from Taiwan (31.0%, a difference of 0.16%), Immigrants from China (31.1%, a difference of 0.20%), Immigrants from Ecuador (31.0%, a difference of 0.20%), Barbadian (31.0%, a difference of 0.23%), and Dominican (31.2%, a difference of 0.35%).
| Demographics | Rating | Rank | In Labor Force | Age 16-19 |
| Soviet Union | 0.0 /100 | #319 | Tragic 31.4% |
| Ecuadorians | 0.0 /100 | #320 | Tragic 31.4% |
| West Indians | 0.0 /100 | #321 | Tragic 31.3% |
| Tohono O'odham | 0.0 /100 | #322 | Tragic 31.3% |
| Immigrants | Caribbean | 0.0 /100 | #323 | Tragic 31.2% |
| Dominicans | 0.0 /100 | #324 | Tragic 31.2% |
| Immigrants | China | 0.0 /100 | #325 | Tragic 31.1% |
| Immigrants | Dominican Republic | 0.0 /100 | #326 | Tragic 31.1% |
| Immigrants | Taiwan | 0.0 /100 | #327 | Tragic 31.0% |
| Immigrants | Ecuador | 0.0 /100 | #328 | Tragic 31.0% |
| Barbadians | 0.0 /100 | #329 | Tragic 31.0% |
| Lumbee | 0.0 /100 | #330 | Tragic 31.0% |
| Trinidadians and Tobagonians | 0.0 /100 | #331 | Tragic 30.9% |
| Immigrants | Israel | 0.0 /100 | #332 | Tragic 30.5% |
| Immigrants | Hong Kong | 0.0 /100 | #333 | Tragic 30.5% |