Immigrants from Kenya vs Thai In Labor Force | Age 16-19
COMPARE
Immigrants from Kenya
Thai
In Labor Force | Age 16-19
In Labor Force | Age 16-19 Comparison
Immigrants from Kenya
Thais
40.5%
IN LABOR FORCE | AGE 16-19
100.0/ 100
METRIC RATING
53rd/ 347
METRIC RANK
34.6%
IN LABOR FORCE | AGE 16-19
1.2/ 100
METRIC RATING
258th/ 347
METRIC RANK
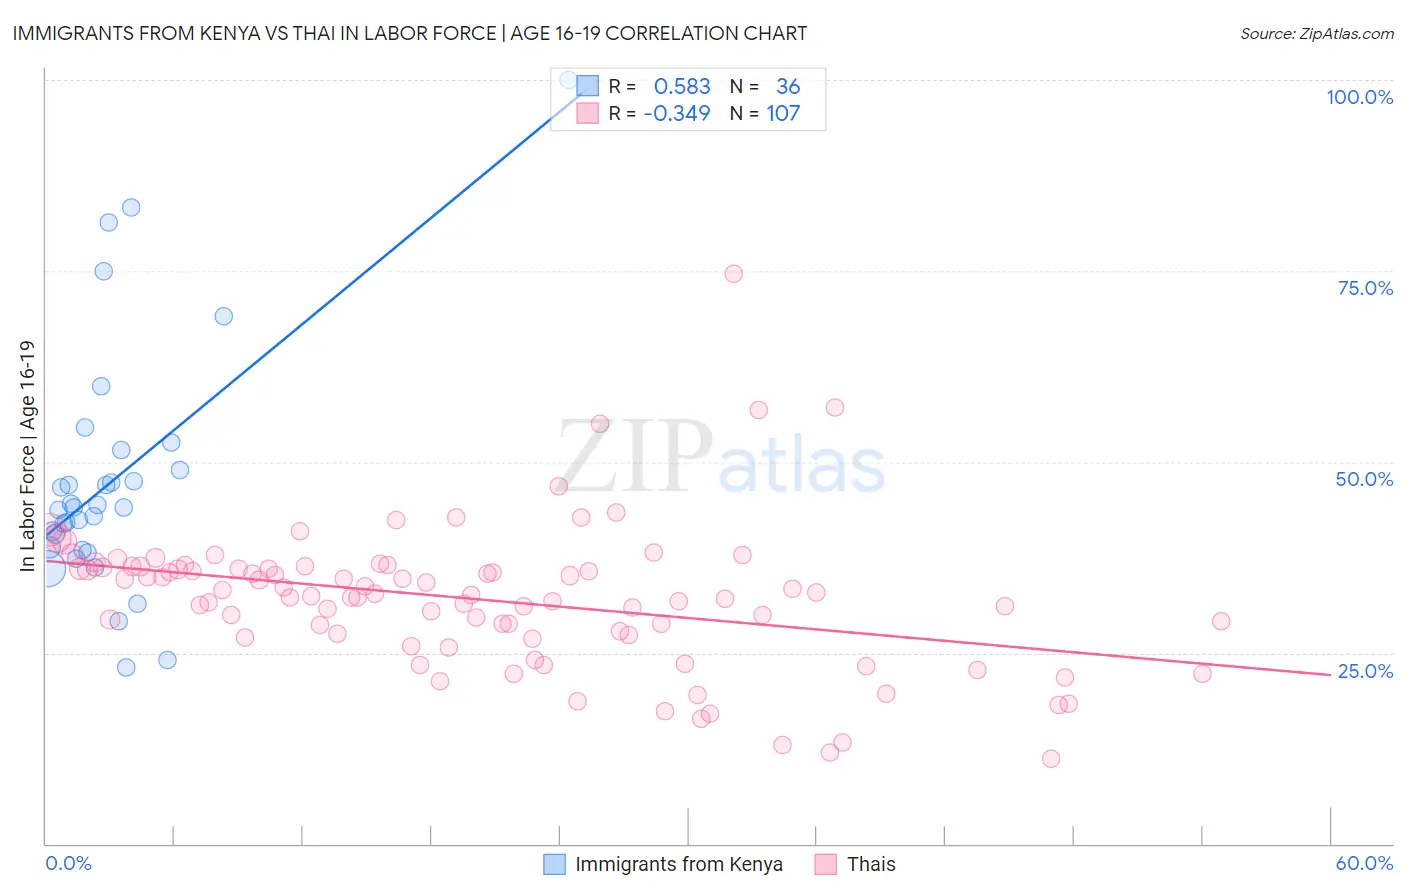
Immigrants from Kenya vs Thai In Labor Force | Age 16-19 Correlation Chart
The statistical analysis conducted on geographies consisting of 218,036,354 people shows a substantial positive correlation between the proportion of Immigrants from Kenya and labor force participation rate among population between the ages 16 and 19 in the United States with a correlation coefficient (R) of 0.583 and weighted average of 40.5%. Similarly, the statistical analysis conducted on geographies consisting of 474,909,482 people shows a mild negative correlation between the proportion of Thais and labor force participation rate among population between the ages 16 and 19 in the United States with a correlation coefficient (R) of -0.349 and weighted average of 34.6%, a difference of 17.2%.
In Labor Force | Age 16-19 Correlation Summary
| Measurement | Immigrants from Kenya | Thai |
| Minimum | 23.0% | 11.1% |
| Maximum | 100.0% | 74.6% |
| Range | 77.0% | 63.5% |
| Mean | 47.7% | 32.0% |
| Median | 44.0% | 32.6% |
| Interquartile 25% (IQ1) | 38.6% | 27.3% |
| Interquartile 75% (IQ3) | 50.3% | 36.2% |
| Interquartile Range (IQR) | 11.7% | 9.0% |
| Standard Deviation (Sample) | 16.3% | 9.4% |
| Standard Deviation (Population) | 16.0% | 9.4% |
Similar Demographics by In Labor Force | Age 16-19
Demographics Similar to Immigrants from Kenya by In Labor Force | Age 16-19
In terms of in labor force | age 16-19, the demographic groups most similar to Immigrants from Kenya are Tlingit-Haida (40.5%, a difference of 0.030%), British (40.5%, a difference of 0.060%), Fijian (40.4%, a difference of 0.15%), Lithuanian (40.4%, a difference of 0.17%), and Aleut (40.4%, a difference of 0.19%).
| Demographics | Rating | Rank | In Labor Force | Age 16-19 |
| Immigrants | Sudan | 100.0 /100 | #46 | Exceptional 41.0% |
| Carpatho Rusyns | 100.0 /100 | #47 | Exceptional 40.8% |
| Icelanders | 100.0 /100 | #48 | Exceptional 40.8% |
| Cree | 100.0 /100 | #49 | Exceptional 40.8% |
| Indonesians | 100.0 /100 | #50 | Exceptional 40.7% |
| Immigrants | Zaire | 100.0 /100 | #51 | Exceptional 40.7% |
| Immigrants | Laos | 100.0 /100 | #52 | Exceptional 40.6% |
| Immigrants | Kenya | 100.0 /100 | #53 | Exceptional 40.5% |
| Tlingit-Haida | 100.0 /100 | #54 | Exceptional 40.5% |
| British | 100.0 /100 | #55 | Exceptional 40.5% |
| Fijians | 100.0 /100 | #56 | Exceptional 40.4% |
| Lithuanians | 100.0 /100 | #57 | Exceptional 40.4% |
| Aleuts | 100.0 /100 | #58 | Exceptional 40.4% |
| Slavs | 100.0 /100 | #59 | Exceptional 40.4% |
| Immigrants | Eastern Africa | 100.0 /100 | #60 | Exceptional 40.4% |
Demographics Similar to Thais by In Labor Force | Age 16-19
In terms of in labor force | age 16-19, the demographic groups most similar to Thais are Immigrants from South Central Asia (34.6%, a difference of 0.010%), Immigrants from Egypt (34.6%, a difference of 0.010%), Immigrants (34.6%, a difference of 0.020%), Egyptian (34.5%, a difference of 0.10%), and Peruvian (34.6%, a difference of 0.12%).
| Demographics | Rating | Rank | In Labor Force | Age 16-19 |
| Immigrants | Western Asia | 2.0 /100 | #251 | Tragic 34.8% |
| Immigrants | Chile | 2.0 /100 | #252 | Tragic 34.8% |
| Immigrants | Japan | 1.5 /100 | #253 | Tragic 34.7% |
| Bahamians | 1.4 /100 | #254 | Tragic 34.6% |
| Peruvians | 1.4 /100 | #255 | Tragic 34.6% |
| Immigrants | South Central Asia | 1.3 /100 | #256 | Tragic 34.6% |
| Immigrants | Egypt | 1.2 /100 | #257 | Tragic 34.6% |
| Thais | 1.2 /100 | #258 | Tragic 34.6% |
| Immigrants | Immigrants | 1.2 /100 | #259 | Tragic 34.6% |
| Egyptians | 1.2 /100 | #260 | Tragic 34.5% |
| Salvadorans | 1.1 /100 | #261 | Tragic 34.5% |
| Hispanics or Latinos | 1.1 /100 | #262 | Tragic 34.5% |
| Burmese | 1.1 /100 | #263 | Tragic 34.5% |
| Immigrants | Uruguay | 0.9 /100 | #264 | Tragic 34.4% |
| Immigrants | El Salvador | 0.7 /100 | #265 | Tragic 34.3% |