Guyanese vs Immigrants In Labor Force | Age 20-64
COMPARE
Guyanese
Immigrants
In Labor Force | Age 20-64
In Labor Force | Age 20-64 Comparison
Guyanese
Immigrants
78.1%
IN LABOR FORCE | AGE 20-64
0.0/ 100
METRIC RATING
281st/ 347
METRIC RANK
79.2%
IN LABOR FORCE | AGE 20-64
7.7/ 100
METRIC RATING
220th/ 347
METRIC RANK
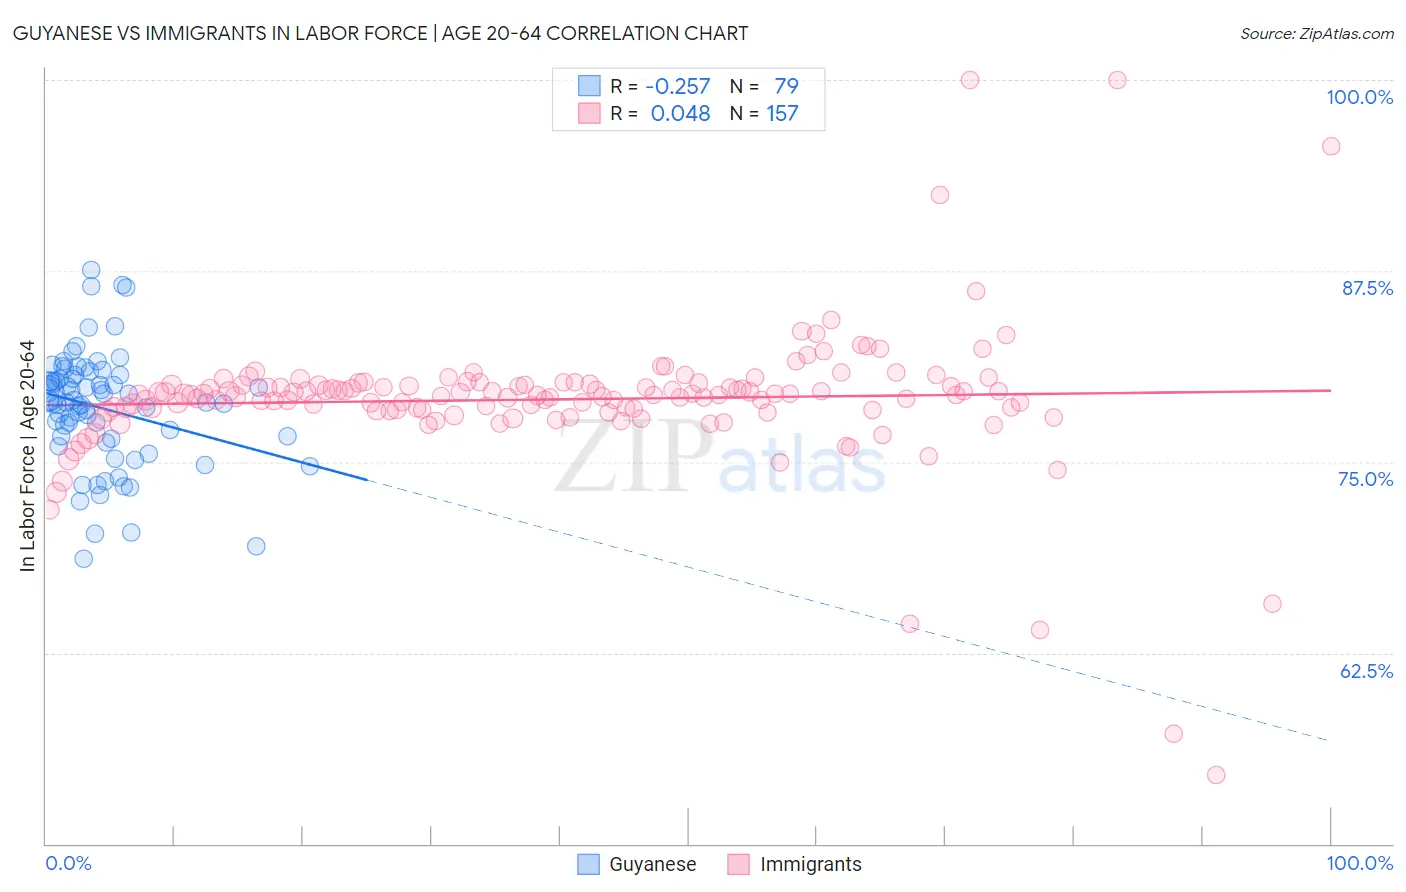
Guyanese vs Immigrants In Labor Force | Age 20-64 Correlation Chart
The statistical analysis conducted on geographies consisting of 176,938,027 people shows a weak negative correlation between the proportion of Guyanese and labor force participation rate among population between the ages 20 and 64 in the United States with a correlation coefficient (R) of -0.257 and weighted average of 78.1%. Similarly, the statistical analysis conducted on geographies consisting of 577,767,057 people shows no correlation between the proportion of Immigrants and labor force participation rate among population between the ages 20 and 64 in the United States with a correlation coefficient (R) of 0.048 and weighted average of 79.2%, a difference of 1.4%.
In Labor Force | Age 20-64 Correlation Summary
| Measurement | Guyanese | Immigrants |
| Minimum | 68.6% | 54.5% |
| Maximum | 87.6% | 100.0% |
| Range | 19.0% | 45.5% |
| Mean | 78.5% | 79.1% |
| Median | 78.9% | 79.4% |
| Interquartile 25% (IQ1) | 76.5% | 78.4% |
| Interquartile 75% (IQ3) | 80.7% | 80.1% |
| Interquartile Range (IQR) | 4.1% | 1.7% |
| Standard Deviation (Sample) | 3.8% | 4.8% |
| Standard Deviation (Population) | 3.7% | 4.8% |
Similar Demographics by In Labor Force | Age 20-64
Demographics Similar to Guyanese by In Labor Force | Age 20-64
In terms of in labor force | age 20-64, the demographic groups most similar to Guyanese are Immigrants from St. Vincent and the Grenadines (78.1%, a difference of 0.020%), Immigrants from Dominica (78.1%, a difference of 0.030%), Nonimmigrants (78.1%, a difference of 0.030%), Immigrants from Guyana (78.1%, a difference of 0.050%), and Belizean (78.2%, a difference of 0.070%).
| Demographics | Rating | Rank | In Labor Force | Age 20-64 |
| Aleuts | 0.0 /100 | #274 | Tragic 78.2% |
| Spanish | 0.0 /100 | #275 | Tragic 78.2% |
| Puget Sound Salish | 0.0 /100 | #276 | Tragic 78.2% |
| Immigrants | Bahamas | 0.0 /100 | #277 | Tragic 78.2% |
| Mexican American Indians | 0.0 /100 | #278 | Tragic 78.2% |
| Belizeans | 0.0 /100 | #279 | Tragic 78.2% |
| Immigrants | Dominica | 0.0 /100 | #280 | Tragic 78.1% |
| Guyanese | 0.0 /100 | #281 | Tragic 78.1% |
| Immigrants | St. Vincent and the Grenadines | 0.0 /100 | #282 | Tragic 78.1% |
| Immigrants | Nonimmigrants | 0.0 /100 | #283 | Tragic 78.1% |
| Immigrants | Guyana | 0.0 /100 | #284 | Tragic 78.1% |
| Osage | 0.0 /100 | #285 | Tragic 78.0% |
| Immigrants | Belize | 0.0 /100 | #286 | Tragic 78.0% |
| Vietnamese | 0.0 /100 | #287 | Tragic 78.0% |
| Hmong | 0.0 /100 | #288 | Tragic 77.9% |
Demographics Similar to Immigrants by In Labor Force | Age 20-64
In terms of in labor force | age 20-64, the demographic groups most similar to Immigrants are Hungarian (79.2%, a difference of 0.010%), French Canadian (79.2%, a difference of 0.020%), Immigrants from Panama (79.1%, a difference of 0.030%), Canadian (79.1%, a difference of 0.030%), and Immigrants from Uzbekistan (79.1%, a difference of 0.030%).
| Demographics | Rating | Rank | In Labor Force | Age 20-64 |
| Immigrants | Portugal | 12.8 /100 | #213 | Poor 79.3% |
| Immigrants | Armenia | 12.2 /100 | #214 | Poor 79.2% |
| Immigrants | Norway | 12.0 /100 | #215 | Poor 79.2% |
| Arabs | 11.4 /100 | #216 | Poor 79.2% |
| Immigrants | Western Asia | 11.0 /100 | #217 | Poor 79.2% |
| Immigrants | England | 9.3 /100 | #218 | Tragic 79.2% |
| French Canadians | 8.4 /100 | #219 | Tragic 79.2% |
| Immigrants | Immigrants | 7.7 /100 | #220 | Tragic 79.2% |
| Hungarians | 7.2 /100 | #221 | Tragic 79.2% |
| Immigrants | Panama | 6.9 /100 | #222 | Tragic 79.1% |
| Canadians | 6.8 /100 | #223 | Tragic 79.1% |
| Immigrants | Uzbekistan | 6.8 /100 | #224 | Tragic 79.1% |
| Portuguese | 6.4 /100 | #225 | Tragic 79.1% |
| Central Americans | 5.9 /100 | #226 | Tragic 79.1% |
| Immigrants | Western Europe | 5.9 /100 | #227 | Tragic 79.1% |