Palestinian vs Immigrants from Laos In Labor Force | Age 16-19
COMPARE
Palestinian
Immigrants from Laos
In Labor Force | Age 16-19
In Labor Force | Age 16-19 Comparison
Palestinians
Immigrants from Laos
36.8%
IN LABOR FORCE | AGE 16-19
63.1/ 100
METRIC RATING
168th/ 347
METRIC RANK
40.6%
IN LABOR FORCE | AGE 16-19
100.0/ 100
METRIC RATING
52nd/ 347
METRIC RANK
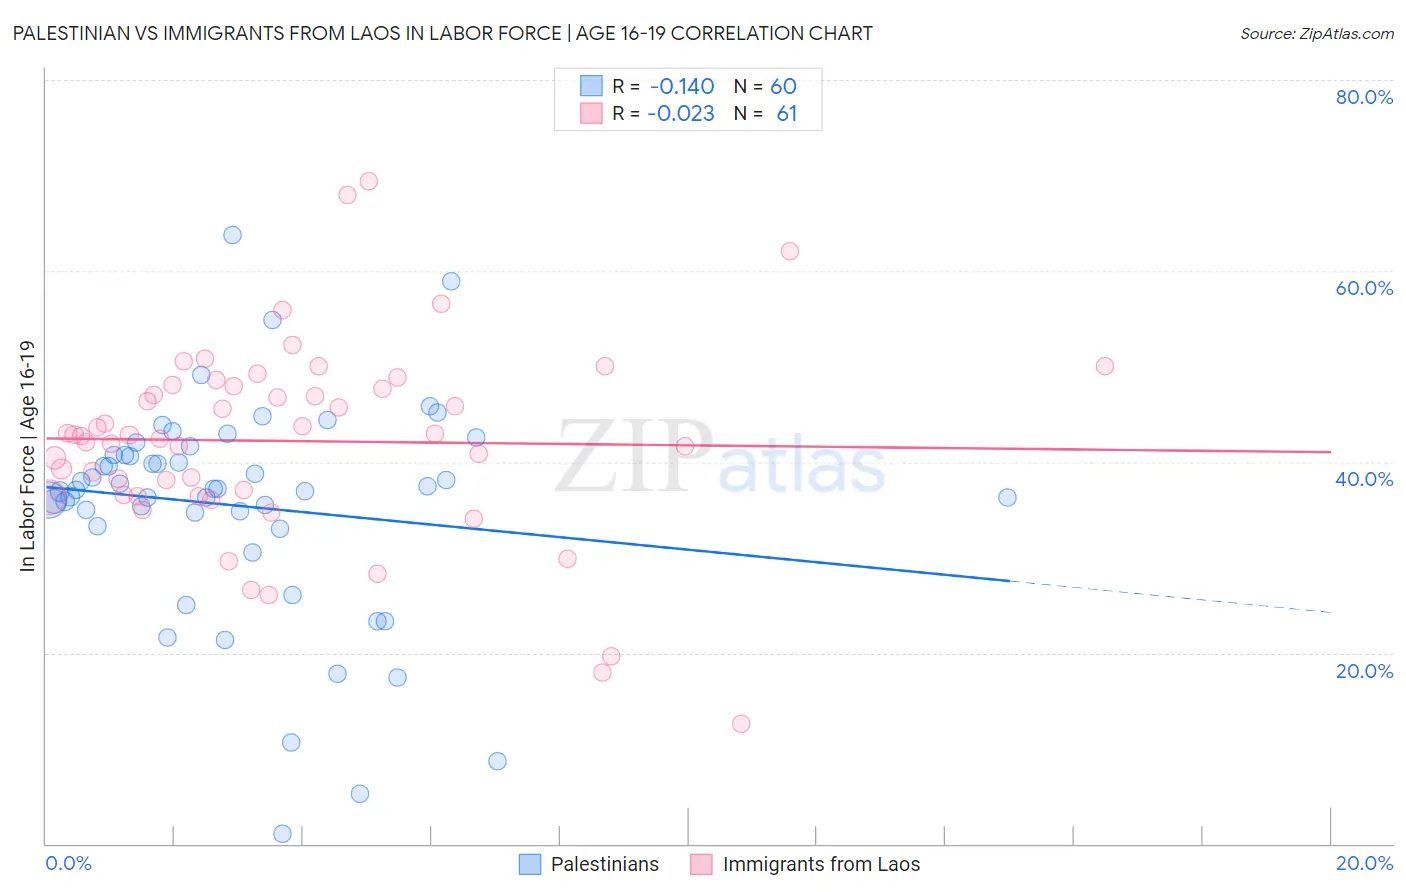
Palestinian vs Immigrants from Laos In Labor Force | Age 16-19 Correlation Chart
The statistical analysis conducted on geographies consisting of 216,397,857 people shows a poor negative correlation between the proportion of Palestinians and labor force participation rate among population between the ages 16 and 19 in the United States with a correlation coefficient (R) of -0.140 and weighted average of 36.8%. Similarly, the statistical analysis conducted on geographies consisting of 201,366,524 people shows no correlation between the proportion of Immigrants from Laos and labor force participation rate among population between the ages 16 and 19 in the United States with a correlation coefficient (R) of -0.023 and weighted average of 40.6%, a difference of 10.4%.
In Labor Force | Age 16-19 Correlation Summary
| Measurement | Palestinian | Immigrants from Laos |
| Minimum | 1.1% | 12.6% |
| Maximum | 63.8% | 69.4% |
| Range | 62.7% | 56.8% |
| Mean | 35.4% | 42.2% |
| Median | 37.1% | 42.8% |
| Interquartile 25% (IQ1) | 34.0% | 36.5% |
| Interquartile 75% (IQ3) | 40.7% | 48.0% |
| Interquartile Range (IQR) | 6.8% | 11.5% |
| Standard Deviation (Sample) | 11.5% | 10.3% |
| Standard Deviation (Population) | 11.4% | 10.3% |
Similar Demographics by In Labor Force | Age 16-19
Demographics Similar to Palestinians by In Labor Force | Age 16-19
In terms of in labor force | age 16-19, the demographic groups most similar to Palestinians are Arab (36.8%, a difference of 0.030%), Immigrants from Latvia (36.8%, a difference of 0.080%), Immigrants from South Africa (36.8%, a difference of 0.14%), Immigrants from Western Africa (36.9%, a difference of 0.20%), and Yakama (36.9%, a difference of 0.21%).
| Demographics | Rating | Rank | In Labor Force | Age 16-19 |
| Cambodians | 71.5 /100 | #161 | Good 37.0% |
| Immigrants | Jordan | 69.5 /100 | #162 | Good 36.9% |
| Bermudans | 69.3 /100 | #163 | Good 36.9% |
| Immigrants | Kuwait | 68.9 /100 | #164 | Good 36.9% |
| Yakama | 66.9 /100 | #165 | Good 36.9% |
| Immigrants | Western Africa | 66.7 /100 | #166 | Good 36.9% |
| Arabs | 63.6 /100 | #167 | Good 36.8% |
| Palestinians | 63.1 /100 | #168 | Good 36.8% |
| Immigrants | Latvia | 61.6 /100 | #169 | Good 36.8% |
| Immigrants | South Africa | 60.5 /100 | #170 | Good 36.8% |
| Immigrants | Cambodia | 58.4 /100 | #171 | Average 36.7% |
| South Africans | 58.3 /100 | #172 | Average 36.7% |
| Russians | 57.5 /100 | #173 | Average 36.7% |
| Immigrants | Czechoslovakia | 50.0 /100 | #174 | Average 36.6% |
| Natives/Alaskans | 49.0 /100 | #175 | Average 36.6% |
Demographics Similar to Immigrants from Laos by In Labor Force | Age 16-19
In terms of in labor force | age 16-19, the demographic groups most similar to Immigrants from Laos are Immigrants from Zaire (40.7%, a difference of 0.090%), Indonesian (40.7%, a difference of 0.19%), Immigrants from Kenya (40.5%, a difference of 0.32%), Cree (40.8%, a difference of 0.34%), and Tlingit-Haida (40.5%, a difference of 0.35%).
| Demographics | Rating | Rank | In Labor Force | Age 16-19 |
| Croatians | 100.0 /100 | #45 | Exceptional 41.1% |
| Immigrants | Sudan | 100.0 /100 | #46 | Exceptional 41.0% |
| Carpatho Rusyns | 100.0 /100 | #47 | Exceptional 40.8% |
| Icelanders | 100.0 /100 | #48 | Exceptional 40.8% |
| Cree | 100.0 /100 | #49 | Exceptional 40.8% |
| Indonesians | 100.0 /100 | #50 | Exceptional 40.7% |
| Immigrants | Zaire | 100.0 /100 | #51 | Exceptional 40.7% |
| Immigrants | Laos | 100.0 /100 | #52 | Exceptional 40.6% |
| Immigrants | Kenya | 100.0 /100 | #53 | Exceptional 40.5% |
| Tlingit-Haida | 100.0 /100 | #54 | Exceptional 40.5% |
| British | 100.0 /100 | #55 | Exceptional 40.5% |
| Fijians | 100.0 /100 | #56 | Exceptional 40.4% |
| Lithuanians | 100.0 /100 | #57 | Exceptional 40.4% |
| Aleuts | 100.0 /100 | #58 | Exceptional 40.4% |
| Slavs | 100.0 /100 | #59 | Exceptional 40.4% |