Immigrants from Colombia vs Immigrants from Laos In Labor Force | Age 16-19
COMPARE
Immigrants from Colombia
Immigrants from Laos
In Labor Force | Age 16-19
In Labor Force | Age 16-19 Comparison
Immigrants from Colombia
Immigrants from Laos
33.5%
IN LABOR FORCE | AGE 16-19
0.1/ 100
METRIC RATING
290th/ 347
METRIC RANK
40.6%
IN LABOR FORCE | AGE 16-19
100.0/ 100
METRIC RATING
52nd/ 347
METRIC RANK
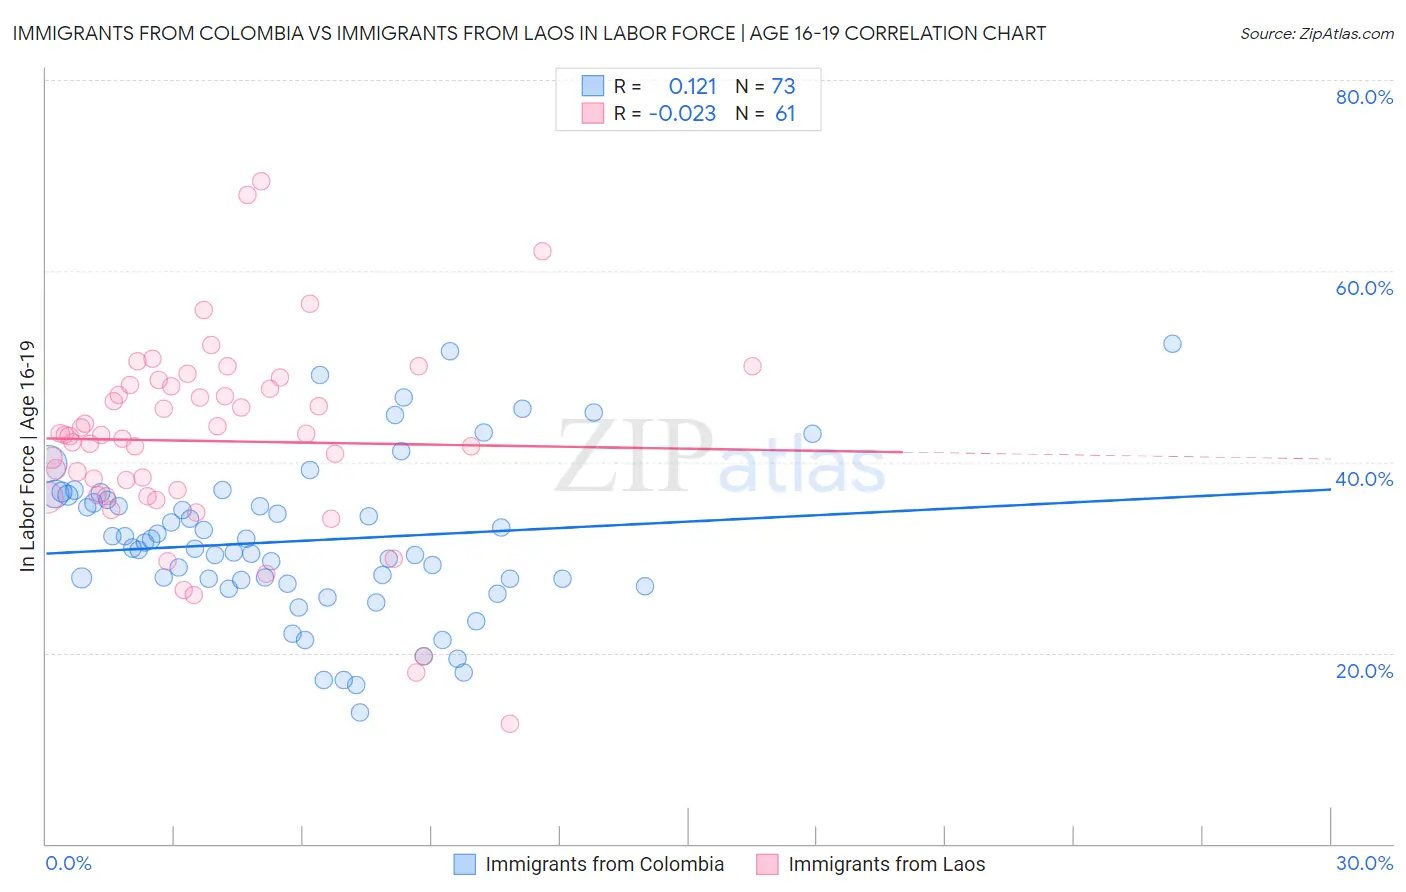
Immigrants from Colombia vs Immigrants from Laos In Labor Force | Age 16-19 Correlation Chart
The statistical analysis conducted on geographies consisting of 378,135,615 people shows a poor positive correlation between the proportion of Immigrants from Colombia and labor force participation rate among population between the ages 16 and 19 in the United States with a correlation coefficient (R) of 0.121 and weighted average of 33.5%. Similarly, the statistical analysis conducted on geographies consisting of 201,366,524 people shows no correlation between the proportion of Immigrants from Laos and labor force participation rate among population between the ages 16 and 19 in the United States with a correlation coefficient (R) of -0.023 and weighted average of 40.6%, a difference of 21.5%.
In Labor Force | Age 16-19 Correlation Summary
| Measurement | Immigrants from Colombia | Immigrants from Laos |
| Minimum | 13.7% | 12.6% |
| Maximum | 52.4% | 69.4% |
| Range | 38.7% | 56.8% |
| Mean | 31.7% | 42.2% |
| Median | 31.0% | 42.8% |
| Interquartile 25% (IQ1) | 27.4% | 36.5% |
| Interquartile 75% (IQ3) | 36.3% | 48.0% |
| Interquartile Range (IQR) | 8.9% | 11.5% |
| Standard Deviation (Sample) | 8.2% | 10.3% |
| Standard Deviation (Population) | 8.1% | 10.3% |
Similar Demographics by In Labor Force | Age 16-19
Demographics Similar to Immigrants from Colombia by In Labor Force | Age 16-19
In terms of in labor force | age 16-19, the demographic groups most similar to Immigrants from Colombia are Immigrants from Belarus (33.4%, a difference of 0.080%), Immigrants from Indonesia (33.5%, a difference of 0.14%), Immigrants from Singapore (33.5%, a difference of 0.14%), Haitian (33.4%, a difference of 0.14%), and Nepalese (33.5%, a difference of 0.18%).
| Demographics | Rating | Rank | In Labor Force | Age 16-19 |
| Immigrants | Venezuela | 0.2 /100 | #283 | Tragic 33.7% |
| Immigrants | Spain | 0.2 /100 | #284 | Tragic 33.7% |
| U.S. Virgin Islanders | 0.2 /100 | #285 | Tragic 33.6% |
| South Americans | 0.2 /100 | #286 | Tragic 33.6% |
| Nepalese | 0.1 /100 | #287 | Tragic 33.5% |
| Immigrants | Indonesia | 0.1 /100 | #288 | Tragic 33.5% |
| Immigrants | Singapore | 0.1 /100 | #289 | Tragic 33.5% |
| Immigrants | Colombia | 0.1 /100 | #290 | Tragic 33.5% |
| Immigrants | Belarus | 0.1 /100 | #291 | Tragic 33.4% |
| Haitians | 0.1 /100 | #292 | Tragic 33.4% |
| Immigrants | South America | 0.1 /100 | #293 | Tragic 33.3% |
| Argentineans | 0.1 /100 | #294 | Tragic 33.3% |
| Yup'ik | 0.1 /100 | #295 | Tragic 33.3% |
| Jamaicans | 0.1 /100 | #296 | Tragic 33.2% |
| Immigrants | Haiti | 0.1 /100 | #297 | Tragic 33.2% |
Demographics Similar to Immigrants from Laos by In Labor Force | Age 16-19
In terms of in labor force | age 16-19, the demographic groups most similar to Immigrants from Laos are Immigrants from Zaire (40.7%, a difference of 0.090%), Indonesian (40.7%, a difference of 0.19%), Immigrants from Kenya (40.5%, a difference of 0.32%), Cree (40.8%, a difference of 0.34%), and Tlingit-Haida (40.5%, a difference of 0.35%).
| Demographics | Rating | Rank | In Labor Force | Age 16-19 |
| Croatians | 100.0 /100 | #45 | Exceptional 41.1% |
| Immigrants | Sudan | 100.0 /100 | #46 | Exceptional 41.0% |
| Carpatho Rusyns | 100.0 /100 | #47 | Exceptional 40.8% |
| Icelanders | 100.0 /100 | #48 | Exceptional 40.8% |
| Cree | 100.0 /100 | #49 | Exceptional 40.8% |
| Indonesians | 100.0 /100 | #50 | Exceptional 40.7% |
| Immigrants | Zaire | 100.0 /100 | #51 | Exceptional 40.7% |
| Immigrants | Laos | 100.0 /100 | #52 | Exceptional 40.6% |
| Immigrants | Kenya | 100.0 /100 | #53 | Exceptional 40.5% |
| Tlingit-Haida | 100.0 /100 | #54 | Exceptional 40.5% |
| British | 100.0 /100 | #55 | Exceptional 40.5% |
| Fijians | 100.0 /100 | #56 | Exceptional 40.4% |
| Lithuanians | 100.0 /100 | #57 | Exceptional 40.4% |
| Aleuts | 100.0 /100 | #58 | Exceptional 40.4% |
| Slavs | 100.0 /100 | #59 | Exceptional 40.4% |