Kenyan vs Immigrants from Laos In Labor Force | Age 16-19
COMPARE
Kenyan
Immigrants from Laos
In Labor Force | Age 16-19
In Labor Force | Age 16-19 Comparison
Kenyans
Immigrants from Laos
40.1%
IN LABOR FORCE | AGE 16-19
100.0/ 100
METRIC RATING
65th/ 347
METRIC RANK
40.6%
IN LABOR FORCE | AGE 16-19
100.0/ 100
METRIC RATING
52nd/ 347
METRIC RANK
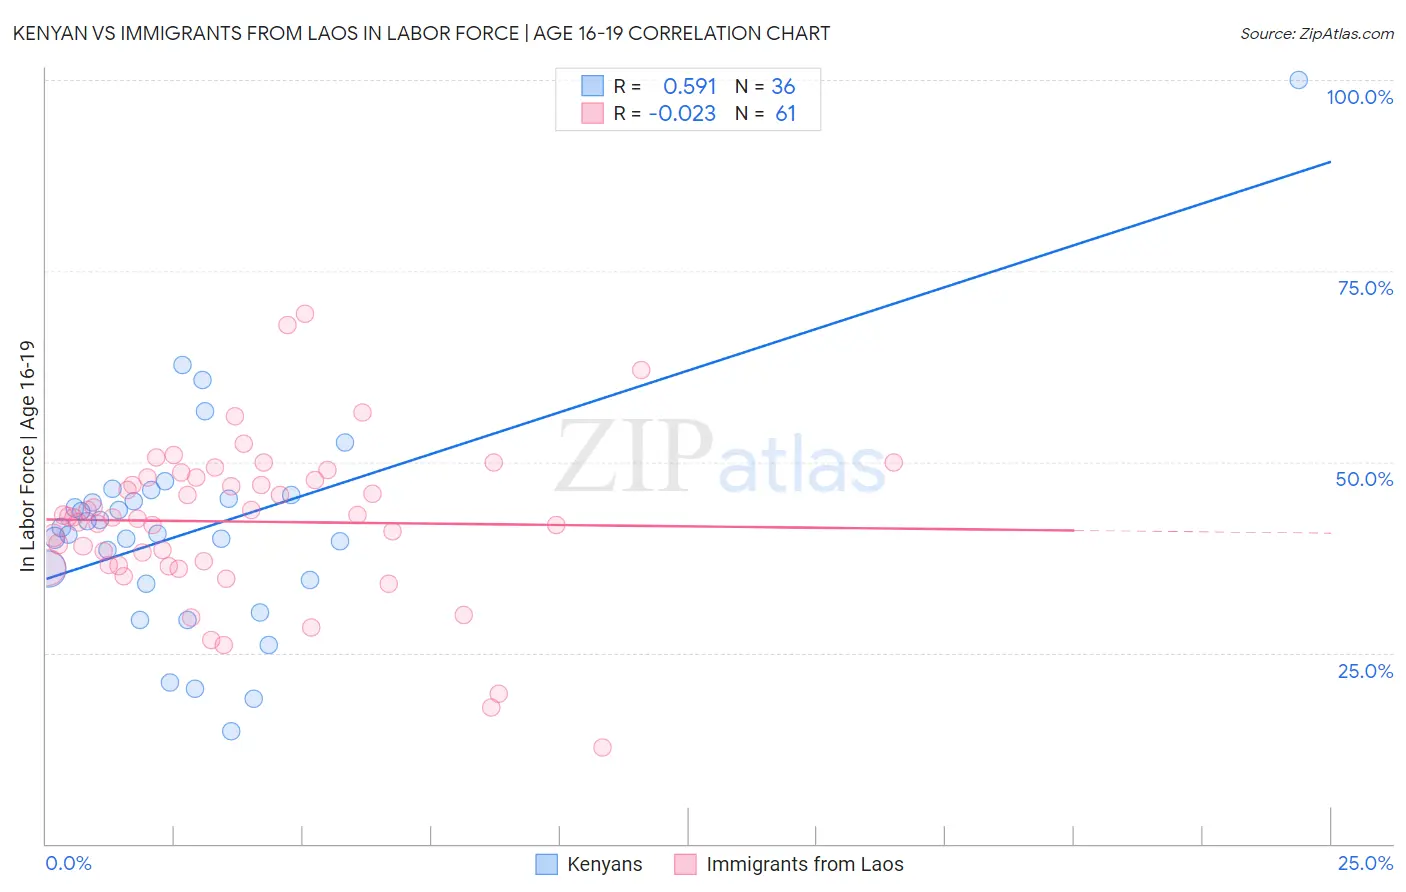
Kenyan vs Immigrants from Laos In Labor Force | Age 16-19 Correlation Chart
The statistical analysis conducted on geographies consisting of 168,228,993 people shows a substantial positive correlation between the proportion of Kenyans and labor force participation rate among population between the ages 16 and 19 in the United States with a correlation coefficient (R) of 0.591 and weighted average of 40.1%. Similarly, the statistical analysis conducted on geographies consisting of 201,366,524 people shows no correlation between the proportion of Immigrants from Laos and labor force participation rate among population between the ages 16 and 19 in the United States with a correlation coefficient (R) of -0.023 and weighted average of 40.6%, a difference of 1.2%.
In Labor Force | Age 16-19 Correlation Summary
| Measurement | Kenyan | Immigrants from Laos |
| Minimum | 14.8% | 12.6% |
| Maximum | 100.0% | 69.4% |
| Range | 85.2% | 56.8% |
| Mean | 41.2% | 42.2% |
| Median | 41.0% | 42.8% |
| Interquartile 25% (IQ1) | 34.3% | 36.5% |
| Interquartile 75% (IQ3) | 45.4% | 48.0% |
| Interquartile Range (IQR) | 11.1% | 11.5% |
| Standard Deviation (Sample) | 14.8% | 10.3% |
| Standard Deviation (Population) | 14.6% | 10.3% |
Demographics Similar to Kenyans and Immigrants from Laos by In Labor Force | Age 16-19
In terms of in labor force | age 16-19, the demographic groups most similar to Kenyans are Immigrants from Micronesia (40.2%, a difference of 0.080%), Nonimmigrants (40.1%, a difference of 0.12%), Canadian (40.1%, a difference of 0.13%), Northern European (40.2%, a difference of 0.19%), and Italian (40.1%, a difference of 0.19%). Similarly, the demographic groups most similar to Immigrants from Laos are Immigrants from Zaire (40.7%, a difference of 0.090%), Indonesian (40.7%, a difference of 0.19%), Immigrants from Kenya (40.5%, a difference of 0.32%), Cree (40.8%, a difference of 0.34%), and Tlingit-Haida (40.5%, a difference of 0.35%).
| Demographics | Rating | Rank | In Labor Force | Age 16-19 |
| Icelanders | 100.0 /100 | #48 | Exceptional 40.8% |
| Cree | 100.0 /100 | #49 | Exceptional 40.8% |
| Indonesians | 100.0 /100 | #50 | Exceptional 40.7% |
| Immigrants | Zaire | 100.0 /100 | #51 | Exceptional 40.7% |
| Immigrants | Laos | 100.0 /100 | #52 | Exceptional 40.6% |
| Immigrants | Kenya | 100.0 /100 | #53 | Exceptional 40.5% |
| Tlingit-Haida | 100.0 /100 | #54 | Exceptional 40.5% |
| British | 100.0 /100 | #55 | Exceptional 40.5% |
| Fijians | 100.0 /100 | #56 | Exceptional 40.4% |
| Lithuanians | 100.0 /100 | #57 | Exceptional 40.4% |
| Aleuts | 100.0 /100 | #58 | Exceptional 40.4% |
| Slavs | 100.0 /100 | #59 | Exceptional 40.4% |
| Immigrants | Eastern Africa | 100.0 /100 | #60 | Exceptional 40.4% |
| Americans | 100.0 /100 | #61 | Exceptional 40.3% |
| Cherokee | 100.0 /100 | #62 | Exceptional 40.2% |
| Northern Europeans | 100.0 /100 | #63 | Exceptional 40.2% |
| Immigrants | Micronesia | 100.0 /100 | #64 | Exceptional 40.2% |
| Kenyans | 100.0 /100 | #65 | Exceptional 40.1% |
| Immigrants | Nonimmigrants | 100.0 /100 | #66 | Exceptional 40.1% |
| Canadians | 100.0 /100 | #67 | Exceptional 40.1% |
| Italians | 99.9 /100 | #68 | Exceptional 40.1% |