Immigrants from Trinidad and Tobago vs Seminole In Labor Force | Age > 16
COMPARE
Immigrants from Trinidad and Tobago
Seminole
In Labor Force | Age > 16
In Labor Force | Age > 16 Comparison
Immigrants from Trinidad and Tobago
Seminole
64.8%
IN LABOR FORCE | AGE > 16
15.6/ 100
METRIC RATING
209th/ 347
METRIC RANK
62.0%
IN LABOR FORCE | AGE > 16
0.0/ 100
METRIC RATING
323rd/ 347
METRIC RANK
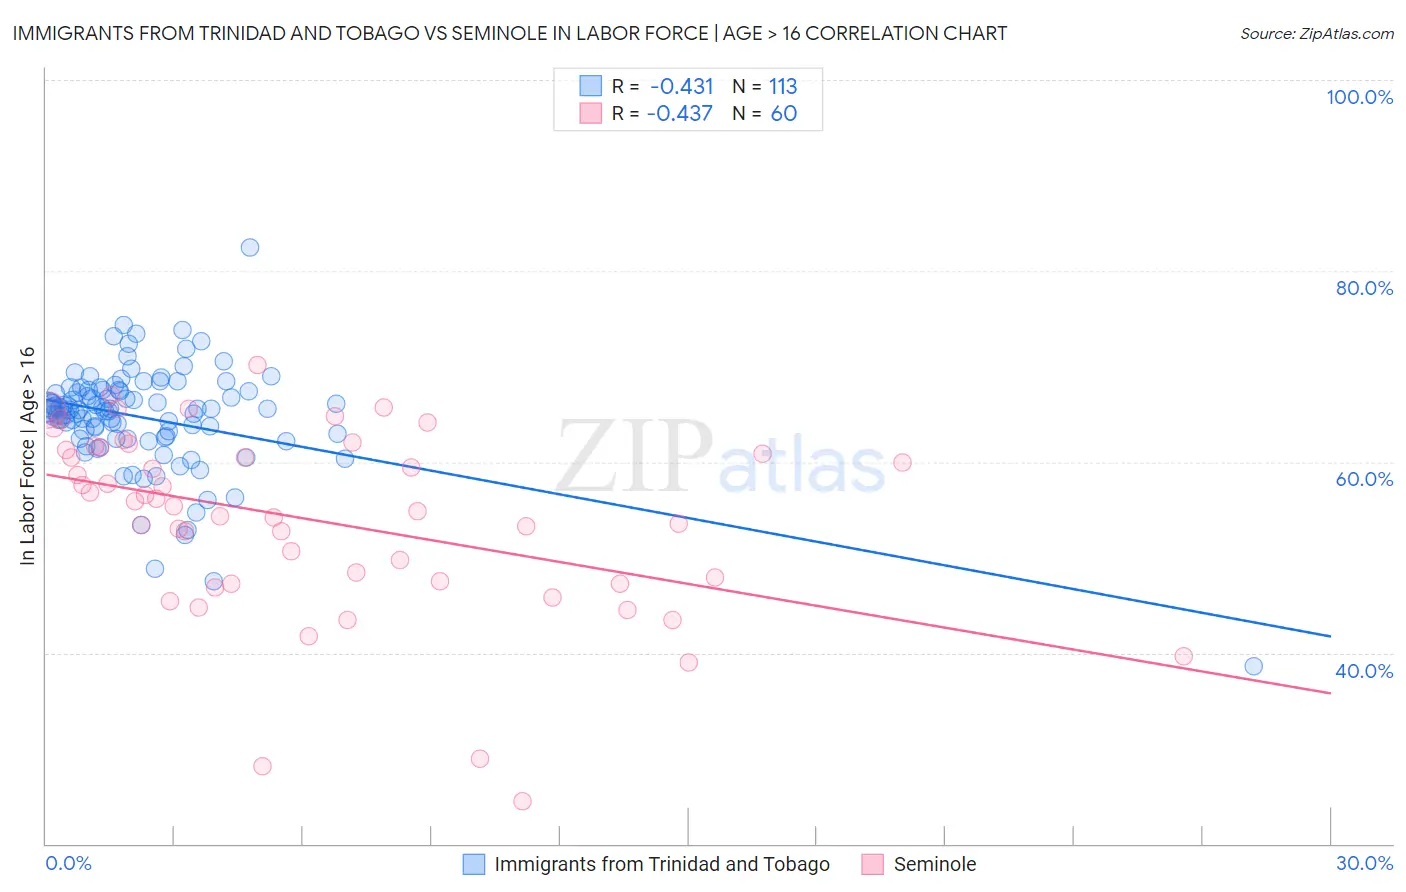
Immigrants from Trinidad and Tobago vs Seminole In Labor Force | Age > 16 Correlation Chart
The statistical analysis conducted on geographies consisting of 223,535,582 people shows a moderate negative correlation between the proportion of Immigrants from Trinidad and Tobago and labor force participation rate among population ages 16 and over in the United States with a correlation coefficient (R) of -0.431 and weighted average of 64.8%. Similarly, the statistical analysis conducted on geographies consisting of 118,310,187 people shows a moderate negative correlation between the proportion of Seminole and labor force participation rate among population ages 16 and over in the United States with a correlation coefficient (R) of -0.437 and weighted average of 62.0%, a difference of 4.5%.
In Labor Force | Age > 16 Correlation Summary
| Measurement | Immigrants from Trinidad and Tobago | Seminole |
| Minimum | 38.6% | 24.4% |
| Maximum | 82.4% | 70.1% |
| Range | 43.8% | 45.7% |
| Mean | 64.6% | 53.9% |
| Median | 65.5% | 55.6% |
| Interquartile 25% (IQ1) | 62.5% | 47.4% |
| Interquartile 75% (IQ3) | 67.4% | 61.4% |
| Interquartile Range (IQR) | 4.9% | 14.1% |
| Standard Deviation (Sample) | 5.6% | 9.8% |
| Standard Deviation (Population) | 5.6% | 9.7% |
Similar Demographics by In Labor Force | Age > 16
Demographics Similar to Immigrants from Trinidad and Tobago by In Labor Force | Age > 16
In terms of in labor force | age > 16, the demographic groups most similar to Immigrants from Trinidad and Tobago are Belizean (64.8%, a difference of 0.010%), Immigrants from Latin America (64.8%, a difference of 0.020%), Immigrants from Denmark (64.8%, a difference of 0.020%), Fijian (64.8%, a difference of 0.030%), and Lithuanian (64.8%, a difference of 0.040%).
| Demographics | Rating | Rank | In Labor Force | Age > 16 |
| Immigrants | Belgium | 19.4 /100 | #202 | Poor 64.9% |
| Russians | 18.8 /100 | #203 | Poor 64.9% |
| Slovenes | 18.7 /100 | #204 | Poor 64.9% |
| Jamaicans | 18.7 /100 | #205 | Poor 64.9% |
| Lithuanians | 17.4 /100 | #206 | Poor 64.8% |
| Immigrants | Latin America | 16.4 /100 | #207 | Poor 64.8% |
| Belizeans | 16.2 /100 | #208 | Poor 64.8% |
| Immigrants | Trinidad and Tobago | 15.6 /100 | #209 | Poor 64.8% |
| Immigrants | Denmark | 14.7 /100 | #210 | Poor 64.8% |
| Fijians | 14.1 /100 | #211 | Poor 64.8% |
| Alaskan Athabascans | 13.9 /100 | #212 | Poor 64.8% |
| Maltese | 13.8 /100 | #213 | Poor 64.8% |
| Estonians | 13.1 /100 | #214 | Poor 64.8% |
| Immigrants | Czechoslovakia | 12.3 /100 | #215 | Poor 64.8% |
| Belgians | 11.4 /100 | #216 | Poor 64.7% |
Demographics Similar to Seminole by In Labor Force | Age > 16
In terms of in labor force | age > 16, the demographic groups most similar to Seminole are Ottawa (62.0%, a difference of 0.030%), Cheyenne (62.0%, a difference of 0.040%), Cherokee (61.9%, a difference of 0.090%), American (62.1%, a difference of 0.18%), and Arapaho (62.1%, a difference of 0.22%).
| Demographics | Rating | Rank | In Labor Force | Age > 16 |
| Yup'ik | 0.0 /100 | #316 | Tragic 62.7% |
| Kiowa | 0.0 /100 | #317 | Tragic 62.4% |
| Chickasaw | 0.0 /100 | #318 | Tragic 62.3% |
| Arapaho | 0.0 /100 | #319 | Tragic 62.1% |
| Yakama | 0.0 /100 | #320 | Tragic 62.1% |
| Americans | 0.0 /100 | #321 | Tragic 62.1% |
| Ottawa | 0.0 /100 | #322 | Tragic 62.0% |
| Seminole | 0.0 /100 | #323 | Tragic 62.0% |
| Cheyenne | 0.0 /100 | #324 | Tragic 62.0% |
| Cherokee | 0.0 /100 | #325 | Tragic 61.9% |
| Sioux | 0.0 /100 | #326 | Tragic 61.8% |
| Cajuns | 0.0 /100 | #327 | Tragic 61.8% |
| Dutch West Indians | 0.0 /100 | #328 | Tragic 61.7% |
| Choctaw | 0.0 /100 | #329 | Tragic 61.5% |
| Creek | 0.0 /100 | #330 | Tragic 61.3% |