Immigrants from Barbados vs Swiss Median Earnings
COMPARE
Immigrants from Barbados
Swiss
Median Earnings
Median Earnings Comparison
Immigrants from Barbados
Swiss
$45,816
MEDIAN EARNINGS
29.6/ 100
METRIC RATING
199th/ 347
METRIC RANK
$46,315
MEDIAN EARNINGS
45.9/ 100
METRIC RATING
182nd/ 347
METRIC RANK
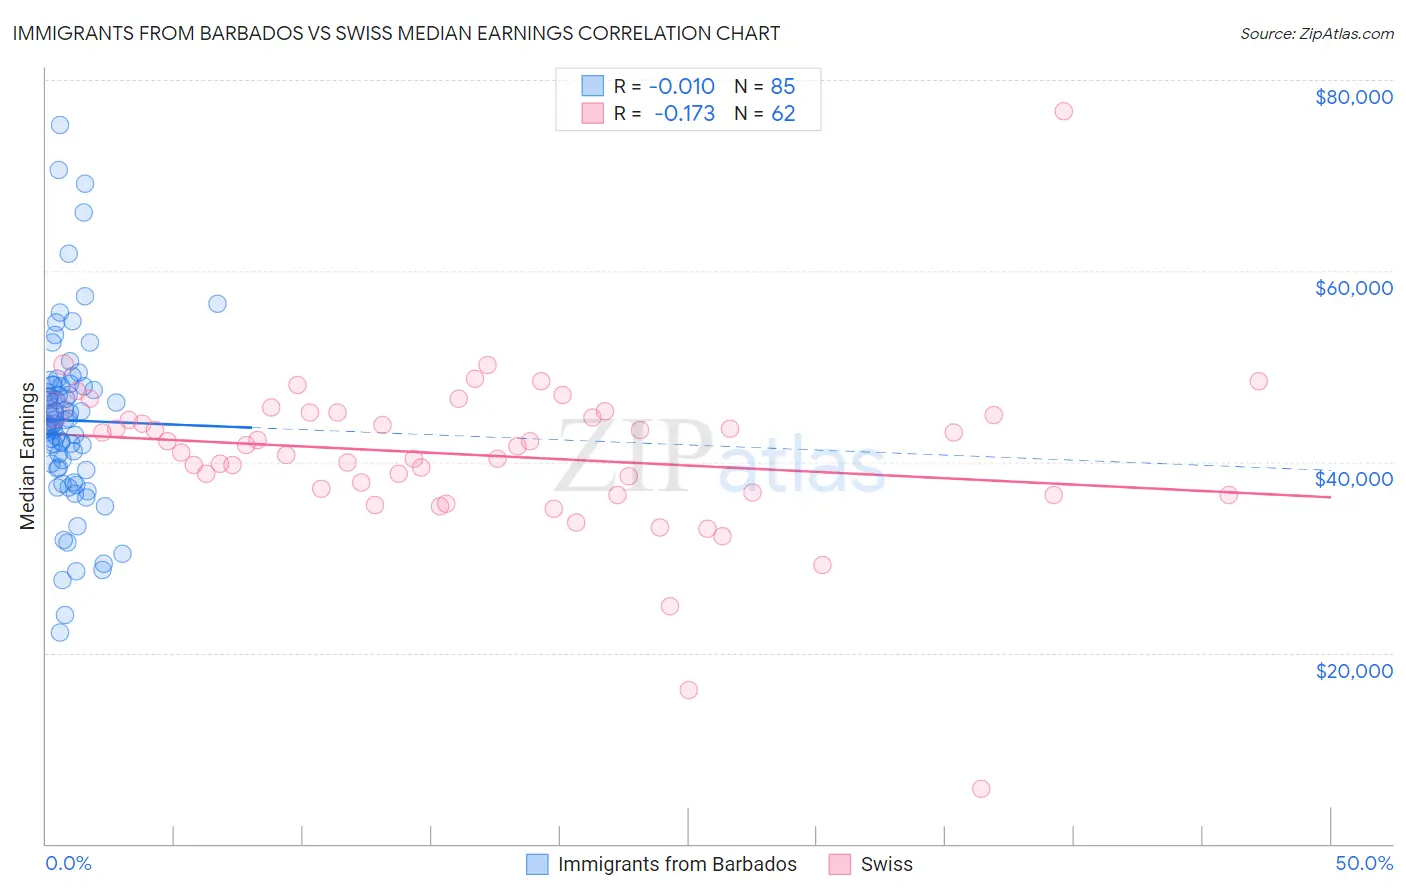
Immigrants from Barbados vs Swiss Median Earnings Correlation Chart
The statistical analysis conducted on geographies consisting of 112,759,497 people shows no correlation between the proportion of Immigrants from Barbados and median earnings in the United States with a correlation coefficient (R) of -0.010 and weighted average of $45,816. Similarly, the statistical analysis conducted on geographies consisting of 464,919,245 people shows a poor negative correlation between the proportion of Swiss and median earnings in the United States with a correlation coefficient (R) of -0.173 and weighted average of $46,315, a difference of 1.1%.
Median Earnings Correlation Summary
| Measurement | Immigrants from Barbados | Swiss |
| Minimum | $22,067 | $5,729 |
| Maximum | $75,335 | $76,771 |
| Range | $53,268 | $71,042 |
| Mean | $44,348 | $40,710 |
| Median | $44,360 | $41,698 |
| Interquartile 25% (IQ1) | $39,293 | $36,797 |
| Interquartile 75% (IQ3) | $47,976 | $45,132 |
| Interquartile Range (IQR) | $8,683 | $8,335 |
| Standard Deviation (Sample) | $9,386 | $8,837 |
| Standard Deviation (Population) | $9,331 | $8,765 |
Demographics Similar to Immigrants from Barbados and Swiss by Median Earnings
In terms of median earnings, the demographic groups most similar to Immigrants from Barbados are Trinidadian and Tobagonian ($45,820, a difference of 0.010%), Immigrants from the Azores ($45,812, a difference of 0.010%), Barbadian ($45,846, a difference of 0.060%), Yugoslavian ($45,846, a difference of 0.070%), and Immigrants from St. Vincent and the Grenadines ($45,908, a difference of 0.20%). Similarly, the demographic groups most similar to Swiss are Immigrants from Cameroon ($46,329, a difference of 0.030%), Puget Sound Salish ($46,333, a difference of 0.040%), French ($46,296, a difference of 0.040%), Immigrants from Kenya ($46,214, a difference of 0.22%), and Uruguayan ($46,190, a difference of 0.27%).
| Demographics | Rating | Rank | Median Earnings |
| Puget Sound Salish | 46.5 /100 | #180 | Average $46,333 |
| Immigrants | Cameroon | 46.4 /100 | #181 | Average $46,329 |
| Swiss | 45.9 /100 | #182 | Average $46,315 |
| French | 45.2 /100 | #183 | Average $46,296 |
| Immigrants | Kenya | 42.4 /100 | #184 | Average $46,214 |
| Uruguayans | 41.6 /100 | #185 | Average $46,190 |
| Vietnamese | 40.9 /100 | #186 | Average $46,172 |
| Iraqis | 39.9 /100 | #187 | Fair $46,140 |
| Immigrants | Armenia | 38.3 /100 | #188 | Fair $46,094 |
| Spaniards | 37.2 /100 | #189 | Fair $46,059 |
| French Canadians | 36.1 /100 | #190 | Fair $46,026 |
| Finns | 33.4 /100 | #191 | Fair $45,940 |
| Germans | 33.2 /100 | #192 | Fair $45,935 |
| Guamanians/Chamorros | 33.2 /100 | #193 | Fair $45,933 |
| Immigrants | Costa Rica | 33.0 /100 | #194 | Fair $45,928 |
| Immigrants | St. Vincent and the Grenadines | 32.4 /100 | #195 | Fair $45,908 |
| Yugoslavians | 30.5 /100 | #196 | Fair $45,846 |
| Barbadians | 30.5 /100 | #197 | Fair $45,846 |
| Trinidadians and Tobagonians | 29.7 /100 | #198 | Fair $45,820 |
| Immigrants | Barbados | 29.6 /100 | #199 | Fair $45,816 |
| Immigrants | Azores | 29.5 /100 | #200 | Fair $45,812 |