Immigrants from Barbados vs Guamanian/Chamorro In Labor Force | Age 45-54
COMPARE
Immigrants from Barbados
Guamanian/Chamorro
In Labor Force | Age 45-54
In Labor Force | Age 45-54 Comparison
Immigrants from Barbados
Guamanians/Chamorros
81.3%
IN LABOR FORCE | AGE 45-54
0.0/ 100
METRIC RATING
271st/ 347
METRIC RANK
81.6%
IN LABOR FORCE | AGE 45-54
0.2/ 100
METRIC RATING
251st/ 347
METRIC RANK
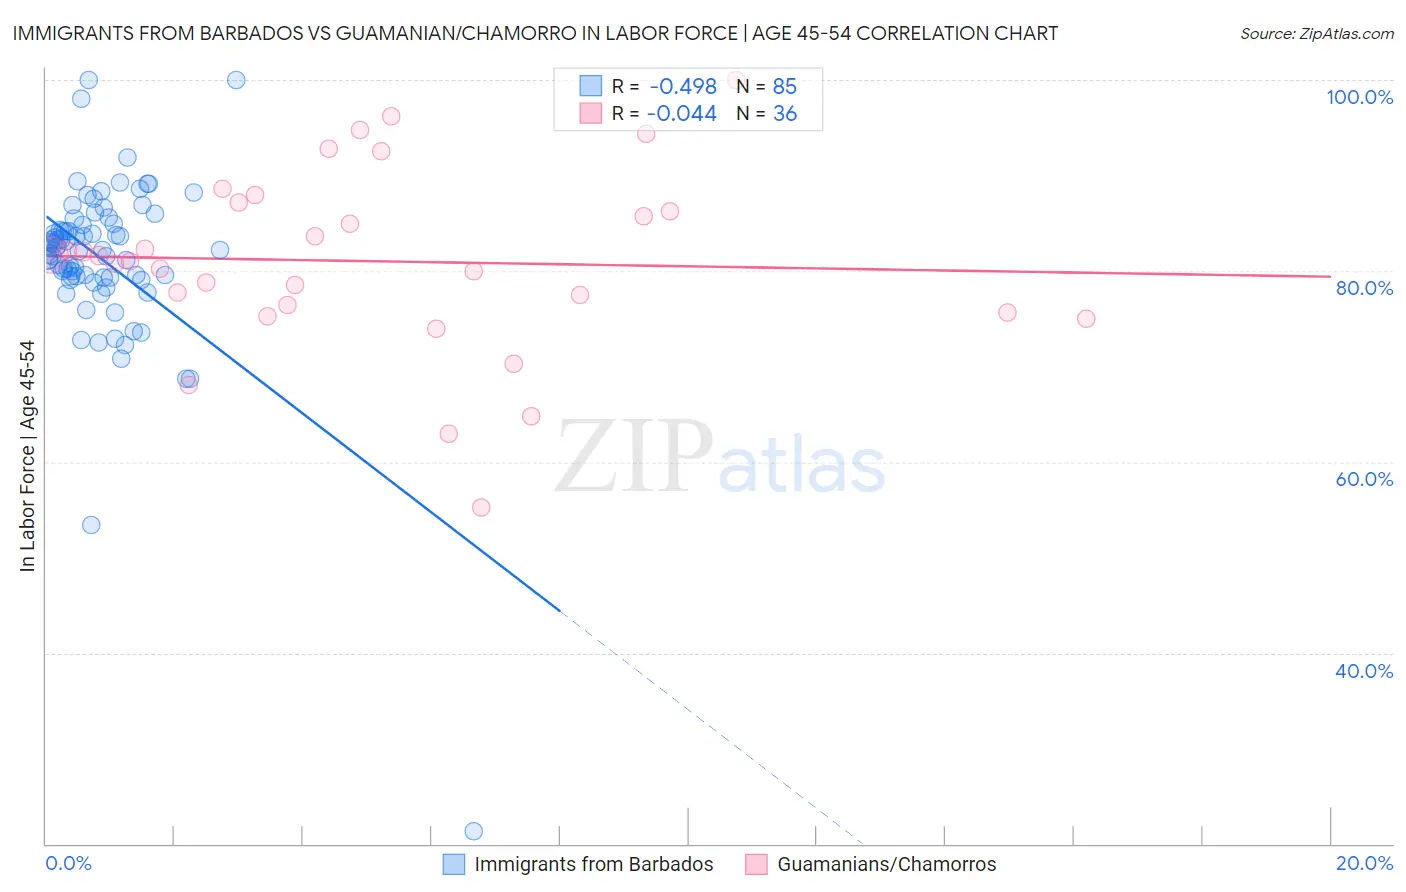
Immigrants from Barbados vs Guamanian/Chamorro In Labor Force | Age 45-54 Correlation Chart
The statistical analysis conducted on geographies consisting of 112,763,171 people shows a moderate negative correlation between the proportion of Immigrants from Barbados and labor force participation rate among population between the ages 45 and 54 in the United States with a correlation coefficient (R) of -0.498 and weighted average of 81.3%. Similarly, the statistical analysis conducted on geographies consisting of 221,888,798 people shows no correlation between the proportion of Guamanians/Chamorros and labor force participation rate among population between the ages 45 and 54 in the United States with a correlation coefficient (R) of -0.044 and weighted average of 81.6%, a difference of 0.40%.
In Labor Force | Age 45-54 Correlation Summary
| Measurement | Immigrants from Barbados | Guamanian/Chamorro |
| Minimum | 21.3% | 55.2% |
| Maximum | 100.0% | 100.0% |
| Range | 78.7% | 44.8% |
| Mean | 81.2% | 81.0% |
| Median | 82.2% | 81.3% |
| Interquartile 25% (IQ1) | 79.3% | 76.0% |
| Interquartile 75% (IQ3) | 84.9% | 86.7% |
| Interquartile Range (IQR) | 5.6% | 10.7% |
| Standard Deviation (Sample) | 9.3% | 9.6% |
| Standard Deviation (Population) | 9.2% | 9.4% |
Demographics Similar to Immigrants from Barbados and Guamanians/Chamorros by In Labor Force | Age 45-54
In terms of in labor force | age 45-54, the demographic groups most similar to Immigrants from Barbados are Bangladeshi (81.3%, a difference of 0.010%), Alsatian (81.3%, a difference of 0.040%), Immigrants from Honduras (81.4%, a difference of 0.060%), Immigrants from St. Vincent and the Grenadines (81.4%, a difference of 0.080%), and West Indian (81.4%, a difference of 0.080%). Similarly, the demographic groups most similar to Guamanians/Chamorros are Pennsylvania German (81.6%, a difference of 0.020%), Japanese (81.6%, a difference of 0.040%), Immigrants from Laos (81.6%, a difference of 0.050%), Scotch-Irish (81.6%, a difference of 0.060%), and Barbadian (81.6%, a difference of 0.090%).
| Demographics | Rating | Rank | In Labor Force | Age 45-54 |
| Guamanians/Chamorros | 0.2 /100 | #251 | Tragic 81.6% |
| Pennsylvania Germans | 0.2 /100 | #252 | Tragic 81.6% |
| Japanese | 0.2 /100 | #253 | Tragic 81.6% |
| Immigrants | Laos | 0.2 /100 | #254 | Tragic 81.6% |
| Scotch-Irish | 0.2 /100 | #255 | Tragic 81.6% |
| Barbadians | 0.1 /100 | #256 | Tragic 81.6% |
| Immigrants | Congo | 0.1 /100 | #257 | Tragic 81.6% |
| Immigrants | Fiji | 0.1 /100 | #258 | Tragic 81.5% |
| Guyanese | 0.1 /100 | #259 | Tragic 81.5% |
| Spaniards | 0.1 /100 | #260 | Tragic 81.5% |
| Hawaiians | 0.1 /100 | #261 | Tragic 81.5% |
| Immigrants | Guyana | 0.1 /100 | #262 | Tragic 81.5% |
| Indonesians | 0.1 /100 | #263 | Tragic 81.5% |
| Immigrants | West Indies | 0.1 /100 | #264 | Tragic 81.5% |
| Hondurans | 0.1 /100 | #265 | Tragic 81.4% |
| Immigrants | St. Vincent and the Grenadines | 0.1 /100 | #266 | Tragic 81.4% |
| West Indians | 0.1 /100 | #267 | Tragic 81.4% |
| Immigrants | Honduras | 0.0 /100 | #268 | Tragic 81.4% |
| Alsatians | 0.0 /100 | #269 | Tragic 81.3% |
| Bangladeshis | 0.0 /100 | #270 | Tragic 81.3% |
| Immigrants | Barbados | 0.0 /100 | #271 | Tragic 81.3% |