Immigrants from Barbados vs Swiss Births to Unmarried Women
COMPARE
Immigrants from Barbados
Swiss
Births to Unmarried Women
Births to Unmarried Women Comparison
Immigrants from Barbados
Swiss
36.8%
BIRTHS TO UNMARRIED WOMEN
0.1/ 100
METRIC RATING
271st/ 347
METRIC RANK
30.5%
BIRTHS TO UNMARRIED WOMEN
83.1/ 100
METRIC RATING
140th/ 347
METRIC RANK
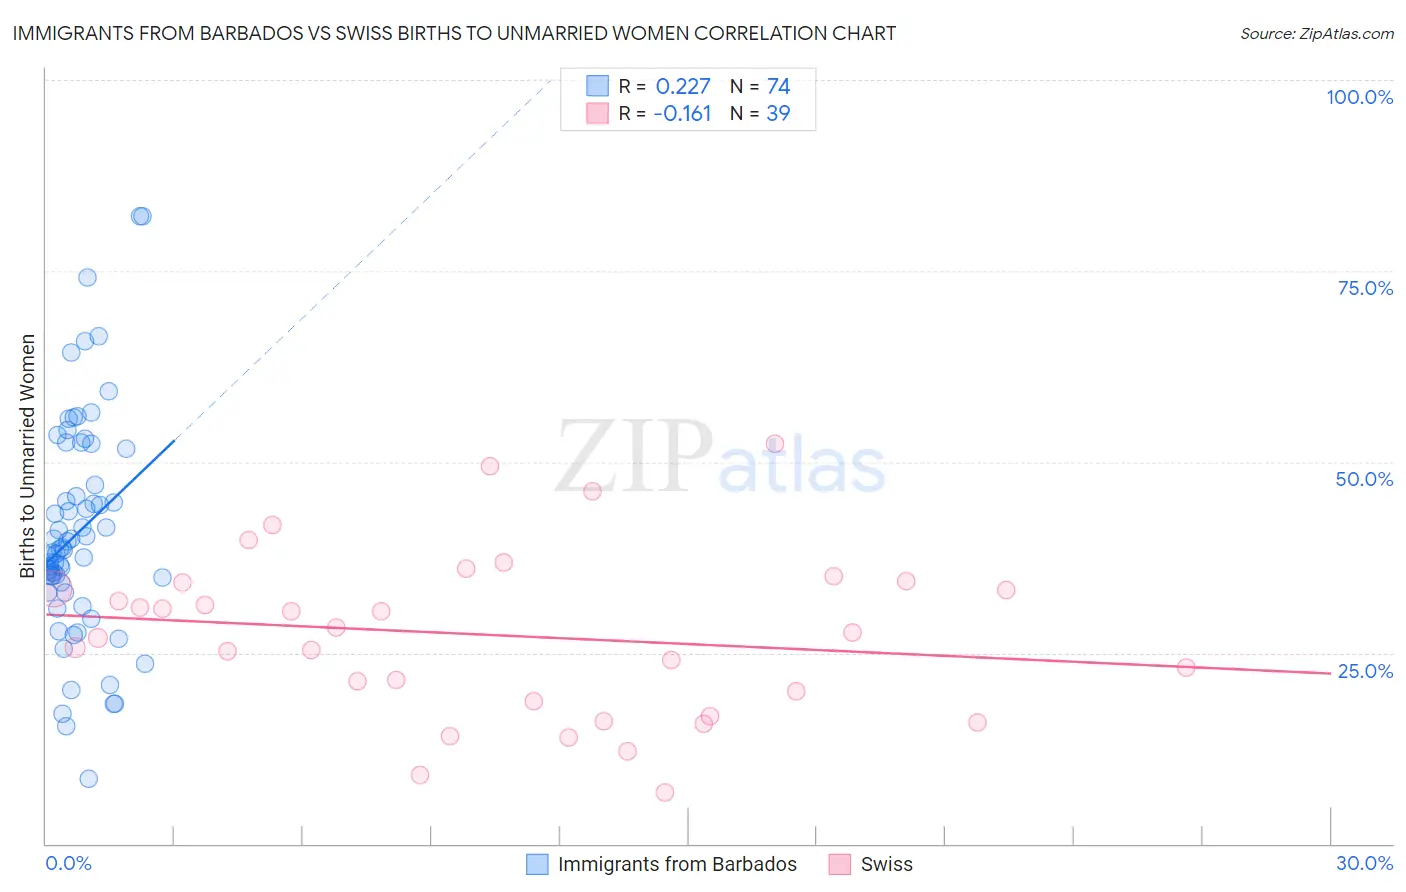
Immigrants from Barbados vs Swiss Births to Unmarried Women Correlation Chart
The statistical analysis conducted on geographies consisting of 110,431,474 people shows a weak positive correlation between the proportion of Immigrants from Barbados and percentage of births to unmarried women in the United States with a correlation coefficient (R) of 0.227 and weighted average of 36.8%. Similarly, the statistical analysis conducted on geographies consisting of 422,325,964 people shows a poor negative correlation between the proportion of Swiss and percentage of births to unmarried women in the United States with a correlation coefficient (R) of -0.161 and weighted average of 30.5%, a difference of 20.7%.
Births to Unmarried Women Correlation Summary
| Measurement | Immigrants from Barbados | Swiss |
| Minimum | 8.5% | 6.7% |
| Maximum | 82.2% | 52.4% |
| Range | 73.7% | 45.7% |
| Mean | 40.7% | 27.3% |
| Median | 38.4% | 27.7% |
| Interquartile 25% (IQ1) | 34.3% | 18.6% |
| Interquartile 75% (IQ3) | 47.0% | 34.3% |
| Interquartile Range (IQR) | 12.7% | 15.6% |
| Standard Deviation (Sample) | 14.4% | 10.8% |
| Standard Deviation (Population) | 14.3% | 10.6% |
Similar Demographics by Births to Unmarried Women
Demographics Similar to Immigrants from Barbados by Births to Unmarried Women
In terms of births to unmarried women, the demographic groups most similar to Immigrants from Barbados are Immigrants from Congo (36.8%, a difference of 0.030%), Senegalese (36.8%, a difference of 0.10%), Comanche (36.7%, a difference of 0.22%), Choctaw (36.9%, a difference of 0.22%), and Central American (36.7%, a difference of 0.23%).
| Demographics | Rating | Rank | Births to Unmarried Women |
| Sub-Saharan Africans | 0.1 /100 | #264 | Tragic 36.7% |
| Cherokee | 0.1 /100 | #265 | Tragic 36.7% |
| Immigrants | Senegal | 0.1 /100 | #266 | Tragic 36.7% |
| Central Americans | 0.1 /100 | #267 | Tragic 36.7% |
| Comanche | 0.1 /100 | #268 | Tragic 36.7% |
| Senegalese | 0.1 /100 | #269 | Tragic 36.8% |
| Immigrants | Congo | 0.1 /100 | #270 | Tragic 36.8% |
| Immigrants | Barbados | 0.1 /100 | #271 | Tragic 36.8% |
| Choctaw | 0.1 /100 | #272 | Tragic 36.9% |
| Mexicans | 0.1 /100 | #273 | Tragic 36.9% |
| Cree | 0.1 /100 | #274 | Tragic 37.0% |
| Barbadians | 0.1 /100 | #275 | Tragic 37.0% |
| Belizeans | 0.1 /100 | #276 | Tragic 37.0% |
| Guatemalans | 0.1 /100 | #277 | Tragic 37.1% |
| Immigrants | Latin America | 0.1 /100 | #278 | Tragic 37.1% |
Demographics Similar to Swiss by Births to Unmarried Women
In terms of births to unmarried women, the demographic groups most similar to Swiss are Pakistani (30.5%, a difference of 0.020%), South African (30.5%, a difference of 0.080%), Immigrants from Uganda (30.5%, a difference of 0.10%), Immigrants from Canada (30.4%, a difference of 0.11%), and Immigrants from Philippines (30.4%, a difference of 0.14%).
| Demographics | Rating | Rank | Births to Unmarried Women |
| Immigrants | Morocco | 85.2 /100 | #133 | Excellent 30.4% |
| Immigrants | South Eastern Asia | 85.2 /100 | #134 | Excellent 30.4% |
| Brazilians | 84.8 /100 | #135 | Excellent 30.4% |
| Immigrants | Scotland | 84.6 /100 | #136 | Excellent 30.4% |
| Immigrants | Philippines | 83.9 /100 | #137 | Excellent 30.4% |
| Puget Sound Salish | 83.9 /100 | #138 | Excellent 30.4% |
| Immigrants | Canada | 83.7 /100 | #139 | Excellent 30.4% |
| Swiss | 83.1 /100 | #140 | Excellent 30.5% |
| Pakistanis | 83.0 /100 | #141 | Excellent 30.5% |
| South Africans | 82.7 /100 | #142 | Excellent 30.5% |
| Immigrants | Uganda | 82.6 /100 | #143 | Excellent 30.5% |
| Czechs | 82.1 /100 | #144 | Excellent 30.5% |
| Immigrants | North America | 81.5 /100 | #145 | Excellent 30.6% |
| Northern Europeans | 81.4 /100 | #146 | Excellent 30.6% |
| Immigrants | Oceania | 81.2 /100 | #147 | Excellent 30.6% |