Immigrants from Barbados vs Immigrants from Eastern Africa In Labor Force | Age 45-54

COMPARE

Immigrants from Barbados
Race
Ancestry
AfghanAfricanAlaska NativeAlaskan AthabascanAlbanianAleutAlsatianAmericanApacheArabArapahoArgentineanArmenianAssyrian/Chaldean/SyriacAustralianAustrianBahamianBangladeshiBarbadianBasqueBelgianBelizeanBermudanBhutaneseBlackfeetBolivianBrazilianBritishBritish West IndianBulgarianBurmeseCajunCambodianCanadianCape VerdeanCarpatho RusynCelticCentral AmericanCentral American IndianCherokeeCheyenneChickasawChileanChineseChippewaChoctawColombianColvilleComancheCosta RicanCreeCreekCroatianCrowCubanCypriotCzechCzechoslovakianDanishDelawareDominicanDutchDutch West IndianEastern EuropeanEcuadorianEgyptianEnglishEstonianEthiopianEuropeanFijianFilipinoFinnishFrenchFrench American IndianFrench CanadianGermanGerman RussianGhanaianGreekGuamanian/ChamorroGuatemalanGuyaneseHaitianHmongHonduranHopiHoumaHungarianIcelanderIndian (Asian)IndonesianInupiatIranianIraqiIrishIroquoisIsraeliItalianJamaicanJapaneseJordanianKenyanKiowaKoreanLaotianLatvianLebaneseLiberianLithuanianLumbeeLuxembourgerMacedonianMalaysianMalteseMarshalleseMenomineeMexicanMexican American IndianMongolianMoroccanNative HawaiianNavajoNepaleseNew ZealanderNicaraguanNigerianNorthern EuropeanNorwegianOkinawanOsageOttawaPaiutePakistaniPalestinianPanamanianParaguayanPennsylvania GermanPeruvianPimaPolishPortuguesePotawatomiPuebloPuerto RicanPuget Sound SalishRomanianRussianSalvadoranSamoanScandinavianScotch-IrishScottishSeminoleSenegaleseSerbianShoshoneSierra LeoneanSiouxSlavicSlovakSloveneSomaliSouth AfricanSouth AmericanSouth American IndianSoviet UnionSpaniardSpanishSpanish AmericanSpanish American IndianSri LankanSubsaharan AfricanSudaneseSwedishSwissSyrianTaiwaneseThaiTlingit-HaidaTohono O'OdhamTonganTrinidadian and TobagonianTsimshianTurkishU.S. Virgin IslanderUgandanUkrainianUruguayanUteVenezuelanVietnameseWelshWest IndianYakamaYaquiYugoslavianYumanYup'ikZimbabwean
Immigration
NonimmigrantsImmigrantsAfghanistanAfricaAlbaniaArgentinaArmeniaAsiaAustraliaAustriaBahamasBangladeshBarbadosBelarusBelgiumBelizeBoliviaBosnia and HerzegovinaBrazilBulgariaBurma/MyanmarCabo VerdeCambodiaCameroonCanadaCaribbeanCentral AmericaChileChinaColombiaCongoCosta RicaCroatiaCubaCzechoslovakiaDenmarkDominicaDominican RepublicEastern AsiaEastern EuropeEcuadorEgyptEl SalvadorEnglandEritreaEthiopiaEuropeFijiFranceGermanyGhanaGreeceGrenadaGuatemalaGuyanaHaitiHondurasHong KongHungaryIndiaIndonesiaIranIraqIrelandIsraelItalyJamaicaJapanJordanKazakhstanKenyaKoreaKuwaitLaosLatin AmericaLatviaLebanonLiberiaLithuaniaMalaysiaMexicoMicronesiaMiddle AfricaMoldovaMoroccoNepalNetherlandsNicaraguaNigeriaNorth AmericaNorth MacedoniaNorthern AfricaNorthern EuropeNorwayOceaniaPakistanPanamaPeruPhilippinesPolandPortugalRomaniaRussiaSaudi ArabiaScotlandSenegalSerbiaSierra LeoneSingaporeSomaliaSouth AfricaSouth AmericaSouth Central AsiaSouth Eastern AsiaSouthern EuropeSpainSri LankaSt. Vincent and the GrenadinesSudanSwedenSwitzerlandSyriaTaiwanThailandTrinidad and TobagoTurkeyUgandaUkraineUruguayUzbekistanVenezuelaVietnamWest IndiesWestern AfricaWestern AsiaWestern EuropeYemenZaireZimbabweAzores
Immigrants from Eastern Africa
Race
Ancestry
AfghanAfricanAlaska NativeAlaskan AthabascanAlbanianAleutAlsatianAmericanApacheArabArapahoArgentineanArmenianAssyrian/Chaldean/SyriacAustralianAustrianBahamianBangladeshiBarbadianBasqueBelgianBelizeanBermudanBhutaneseBlackfeetBolivianBrazilianBritishBritish West IndianBulgarianBurmeseCajunCambodianCanadianCape VerdeanCarpatho RusynCelticCentral AmericanCentral American IndianCherokeeCheyenneChickasawChileanChineseChippewaChoctawColombianColvilleComancheCosta RicanCreeCreekCroatianCrowCubanCypriotCzechCzechoslovakianDanishDelawareDominicanDutchDutch West IndianEastern EuropeanEcuadorianEgyptianEnglishEstonianEthiopianEuropeanFijianFilipinoFinnishFrenchFrench American IndianFrench CanadianGermanGerman RussianGhanaianGreekGuamanian/ChamorroGuatemalanGuyaneseHaitianHmongHonduranHopiHoumaHungarianIcelanderIndian (Asian)IndonesianInupiatIranianIraqiIrishIroquoisIsraeliItalianJamaicanJapaneseJordanianKenyanKiowaKoreanLaotianLatvianLebaneseLiberianLithuanianLumbeeLuxembourgerMacedonianMalaysianMalteseMarshalleseMenomineeMexicanMexican American IndianMongolianMoroccanNative HawaiianNavajoNepaleseNew ZealanderNicaraguanNigerianNorthern EuropeanNorwegianOkinawanOsageOttawaPaiutePakistaniPalestinianPanamanianParaguayanPennsylvania GermanPeruvianPimaPolishPortuguesePotawatomiPuebloPuerto RicanPuget Sound SalishRomanianRussianSalvadoranSamoanScandinavianScotch-IrishScottishSeminoleSenegaleseSerbianShoshoneSierra LeoneanSiouxSlavicSlovakSloveneSomaliSouth AfricanSouth AmericanSouth American IndianSoviet UnionSpaniardSpanishSpanish AmericanSpanish American IndianSri LankanSubsaharan AfricanSudaneseSwedishSwissSyrianTaiwaneseThaiTlingit-HaidaTohono O'OdhamTonganTrinidadian and TobagonianTsimshianTurkishU.S. Virgin IslanderUgandanUkrainianUruguayanUteVenezuelanVietnameseWelshWest IndianYakamaYaquiYugoslavianYumanYup'ikZimbabwean
Immigration
NonimmigrantsImmigrantsAfghanistanAfricaAlbaniaArgentinaArmeniaAsiaAustraliaAustriaBahamasBangladeshBelarusBelgiumBelizeBoliviaBosnia and HerzegovinaBrazilBulgariaBurma/MyanmarCabo VerdeCambodiaCameroonCanadaCaribbeanCentral AmericaChileChinaColombiaCongoCosta RicaCroatiaCubaCzechoslovakiaDenmarkDominicaDominican RepublicEastern AfricaEastern AsiaEastern EuropeEcuadorEgyptEl SalvadorEnglandEritreaEthiopiaEuropeFijiFranceGermanyGhanaGreeceGrenadaGuatemalaGuyanaHaitiHondurasHong KongHungaryIndiaIndonesiaIranIraqIrelandIsraelItalyJamaicaJapanJordanKazakhstanKenyaKoreaKuwaitLaosLatin AmericaLatviaLebanonLiberiaLithuaniaMalaysiaMexicoMicronesiaMiddle AfricaMoldovaMoroccoNepalNetherlandsNicaraguaNigeriaNorth AmericaNorth MacedoniaNorthern AfricaNorthern EuropeNorwayOceaniaPakistanPanamaPeruPhilippinesPolandPortugalRomaniaRussiaSaudi ArabiaScotlandSenegalSerbiaSierra LeoneSingaporeSomaliaSouth AfricaSouth AmericaSouth Central AsiaSouth Eastern AsiaSouthern EuropeSpainSri LankaSt. Vincent and the GrenadinesSudanSwedenSwitzerlandSyriaTaiwanThailandTrinidad and TobagoTurkeyUgandaUkraineUruguayUzbekistanVenezuelaVietnamWest IndiesWestern AfricaWestern AsiaWestern EuropeYemenZaireZimbabweAzores
In Labor Force | Age 45-54
Income
Poverty
Unemployment
Labor Participation
Family Structure
Vehicle Availability
Education Level
Disability

In Labor Force | Age 45-54 Comparison

Immigrants from Barbados

Immigrants from Eastern Africa

Tragic
Exceptional
81.3%
IN LABOR FORCE | AGE 45-54
0.0/ 100
METRIC RATING
271st/ 347
METRIC RANK
83.9%
IN LABOR FORCE | AGE 45-54
99.8/ 100
METRIC RATING
20th/ 347
METRIC RANK

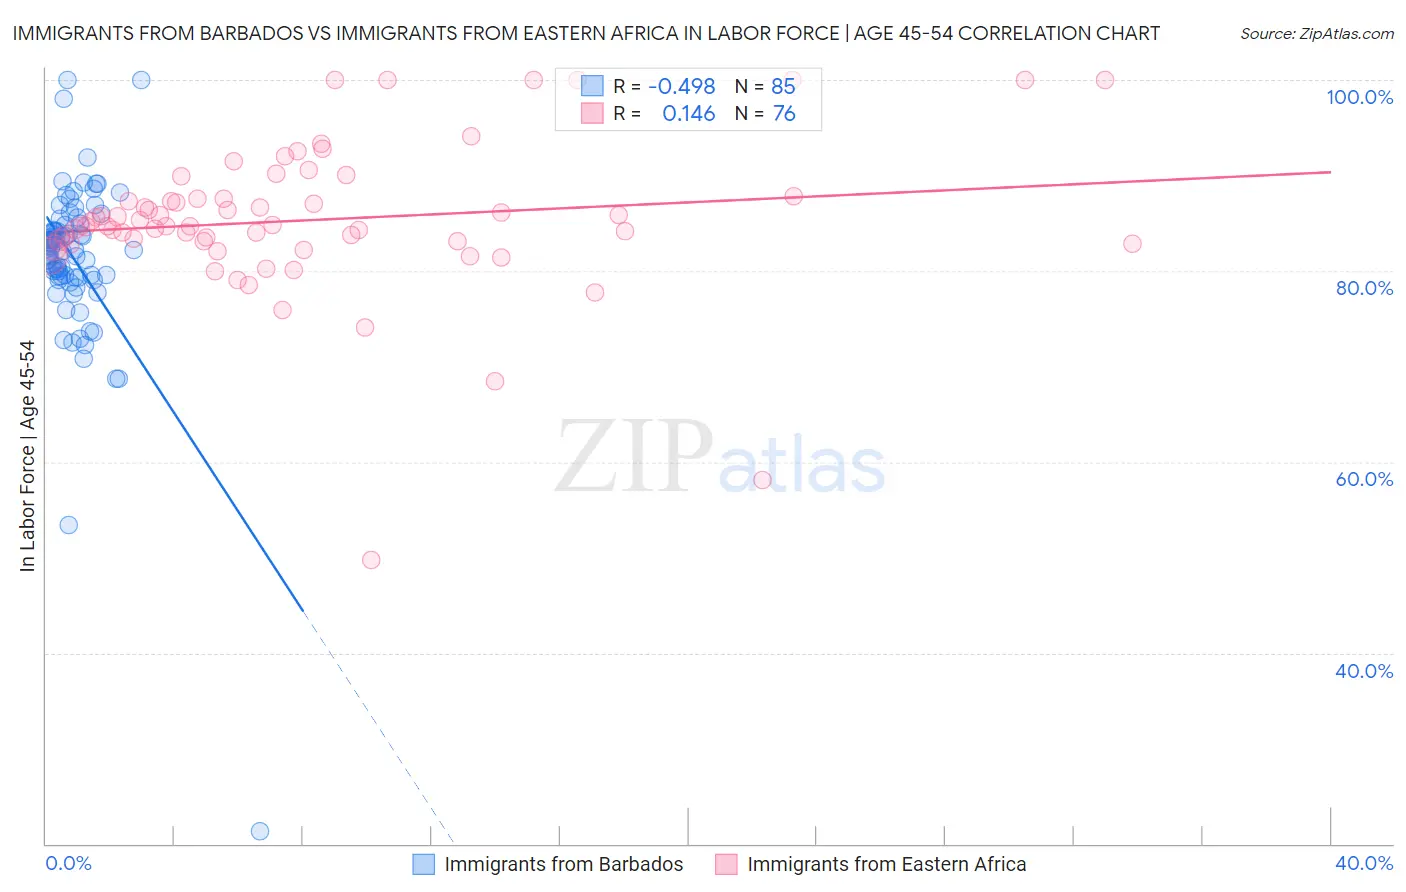
Immigrants from Barbados vs Immigrants from Eastern Africa In Labor Force | Age 45-54 Correlation Chart

The statistical analysis conducted on geographies consisting of 112,763,171 people shows a moderate negative correlation between the proportion of Immigrants from Barbados and labor force participation rate among population between the ages 45 and 54 in the United States with a correlation coefficient (R) of -0.498 and weighted average of 81.3%. Similarly, the statistical analysis conducted on geographies consisting of 354,881,316 people shows a poor positive correlation between the proportion of Immigrants from Eastern Africa and labor force participation rate among population between the ages 45 and 54 in the United States with a correlation coefficient (R) of 0.146 and weighted average of 83.9%, a difference of 3.2%.
Immigrants from Barbados vs Immigrants from Eastern Africa In Labor Force | Age 45-54

In Labor Force | Age 45-54 Correlation Summary

MeasurementImmigrants from BarbadosImmigrants from Eastern Africa
Minimum21.3%49.7%
Maximum100.0%100.0%
Range78.7%50.3%
Mean81.2%85.3%
Median82.2%84.7%
Interquartile 25% (IQ1)79.3%83.0%
Interquartile 75% (IQ3)84.9%87.5%
Interquartile Range (IQR)5.6%4.5%
Standard Deviation (Sample)9.3%8.0%
Standard Deviation (Population)9.2%8.0%

Similar Demographics by In Labor Force | Age 45-54

Demographics Similar to Immigrants from Barbados by In Labor Force | Age 45-54

In terms of in labor force | age 45-54, the demographic groups most similar to Immigrants from Barbados are Bangladeshi (81.3%, a difference of 0.010%), Spanish (81.3%, a difference of 0.010%), Alsatian (81.3%, a difference of 0.040%), Immigrants from Honduras (81.4%, a difference of 0.060%), and Chippewa (81.3%, a difference of 0.070%).
DemographicsRating | RankIn Labor Force | Age 45-54
Immigrants | West Indies
0.1
/100
|
#264
Tragic
81.5%
Hondurans
0.1
/100
|
#265
Tragic
81.4%
Immigrants | St. Vincent and the Grenadines
0.1
/100
|
#266
Tragic
81.4%
West Indians
0.1
/100
|
#267
Tragic
81.4%
Immigrants | Honduras
0.0
/100
|
#268
Tragic
81.4%
Alsatians
0.0
/100
|
#269
Tragic
81.3%
Bangladeshis
0.0
/100
|
#270
Tragic
81.3%
Immigrants | Barbados
0.0
/100
|
#271
Tragic
81.3%
Spanish
0.0
/100
|
#272
Tragic
81.3%
Chippewa
0.0
/100
|
#273
Tragic
81.3%
British West Indians
0.0
/100
|
#274
Tragic
81.2%
Immigrants | Nonimmigrants
0.0
/100
|
#275
Tragic
81.2%
U.S. Virgin Islanders
0.0
/100
|
#276
Tragic
81.2%
Guatemalans
0.0
/100
|
#277
Tragic
81.2%
Immigrants | Guatemala
0.0
/100
|
#278
Tragic
81.1%

Demographics Similar to Immigrants from Eastern Africa by In Labor Force | Age 45-54

In terms of in labor force | age 45-54, the demographic groups most similar to Immigrants from Eastern Africa are Immigrants from Sri Lanka (83.9%, a difference of 0.0%), Immigrants from Ireland (83.9%, a difference of 0.0%), Czech (83.9%, a difference of 0.010%), Tlingit-Haida (83.9%, a difference of 0.010%), and Slovene (83.9%, a difference of 0.010%).
DemographicsRating | RankIn Labor Force | Age 45-54
Chinese
99.9
/100
|
#13
Exceptional
84.1%
Cambodians
99.9
/100
|
#14
Exceptional
84.1%
Cypriots
99.9
/100
|
#15
Exceptional
84.1%
Immigrants | Nepal
99.9
/100
|
#16
Exceptional
84.0%
Zimbabweans
99.9
/100
|
#17
Exceptional
84.0%
Immigrants | South Central Asia
99.9
/100
|
#18
Exceptional
84.0%
Czechs
99.8
/100
|
#19
Exceptional
83.9%
Immigrants | Eastern Africa
99.8
/100
|
#20
Exceptional
83.9%
Immigrants | Sri Lanka
99.8
/100
|
#21
Exceptional
83.9%
Immigrants | Ireland
99.8
/100
|
#22
Exceptional
83.9%
Tlingit-Haida
99.8
/100
|
#23
Exceptional
83.9%
Slovenes
99.8
/100
|
#24
Exceptional
83.9%
Immigrants | North Macedonia
99.8
/100
|
#25
Exceptional
83.9%
Immigrants | Serbia
99.8
/100
|
#26
Exceptional
83.9%
Immigrants | Brazil
99.8
/100
|
#27
Exceptional
83.9%