Alaskan Athabascan vs New Zealander In Labor Force | Age 20-64
COMPARE
Alaskan Athabascan
New Zealander
In Labor Force | Age 20-64
In Labor Force | Age 20-64 Comparison
Alaskan Athabascans
New Zealanders
76.9%
IN LABOR FORCE | AGE 20-64
0.0/ 100
METRIC RATING
312th/ 347
METRIC RANK
79.7%
IN LABOR FORCE | AGE 20-64
69.4/ 100
METRIC RATING
154th/ 347
METRIC RANK
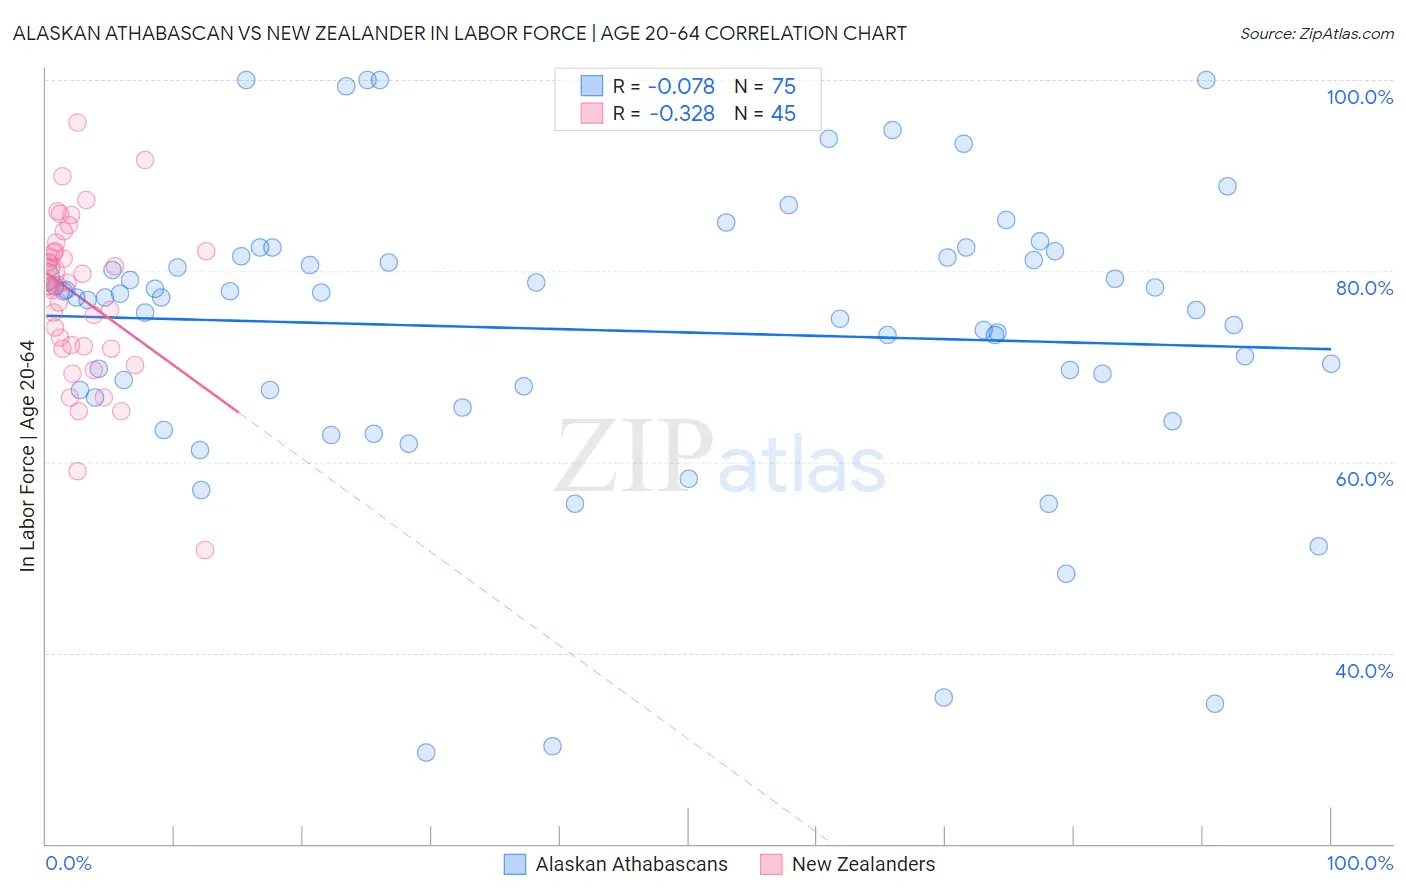
Alaskan Athabascan vs New Zealander In Labor Force | Age 20-64 Correlation Chart
The statistical analysis conducted on geographies consisting of 45,821,503 people shows a slight negative correlation between the proportion of Alaskan Athabascans and labor force participation rate among population between the ages 20 and 64 in the United States with a correlation coefficient (R) of -0.078 and weighted average of 76.9%. Similarly, the statistical analysis conducted on geographies consisting of 106,923,900 people shows a mild negative correlation between the proportion of New Zealanders and labor force participation rate among population between the ages 20 and 64 in the United States with a correlation coefficient (R) of -0.328 and weighted average of 79.7%, a difference of 3.7%.
In Labor Force | Age 20-64 Correlation Summary
| Measurement | Alaskan Athabascan | New Zealander |
| Minimum | 29.5% | 50.8% |
| Maximum | 100.0% | 95.6% |
| Range | 70.5% | 44.8% |
| Mean | 73.8% | 77.3% |
| Median | 77.2% | 78.6% |
| Interquartile 25% (IQ1) | 67.5% | 72.0% |
| Interquartile 75% (IQ3) | 81.4% | 82.1% |
| Interquartile Range (IQR) | 13.9% | 10.1% |
| Standard Deviation (Sample) | 15.0% | 8.5% |
| Standard Deviation (Population) | 14.9% | 8.4% |
Similar Demographics by In Labor Force | Age 20-64
Demographics Similar to Alaskan Athabascans by In Labor Force | Age 20-64
In terms of in labor force | age 20-64, the demographic groups most similar to Alaskan Athabascans are Shoshone (76.8%, a difference of 0.12%), Black/African American (76.8%, a difference of 0.14%), Blackfeet (77.0%, a difference of 0.17%), Comanche (77.0%, a difference of 0.21%), and American (77.0%, a difference of 0.22%).
| Demographics | Rating | Rank | In Labor Force | Age 20-64 |
| Mexicans | 0.0 /100 | #305 | Tragic 77.2% |
| Potawatomi | 0.0 /100 | #306 | Tragic 77.2% |
| Central American Indians | 0.0 /100 | #307 | Tragic 77.1% |
| Alaska Natives | 0.0 /100 | #308 | Tragic 77.0% |
| Americans | 0.0 /100 | #309 | Tragic 77.0% |
| Comanche | 0.0 /100 | #310 | Tragic 77.0% |
| Blackfeet | 0.0 /100 | #311 | Tragic 77.0% |
| Alaskan Athabascans | 0.0 /100 | #312 | Tragic 76.9% |
| Shoshone | 0.0 /100 | #313 | Tragic 76.8% |
| Blacks/African Americans | 0.0 /100 | #314 | Tragic 76.8% |
| Ottawa | 0.0 /100 | #315 | Tragic 76.7% |
| Yaqui | 0.0 /100 | #316 | Tragic 76.5% |
| Cherokee | 0.0 /100 | #317 | Tragic 76.2% |
| Chickasaw | 0.0 /100 | #318 | Tragic 76.2% |
| Inupiat | 0.0 /100 | #319 | Tragic 76.1% |
Demographics Similar to New Zealanders by In Labor Force | Age 20-64
In terms of in labor force | age 20-64, the demographic groups most similar to New Zealanders are Immigrants from Kazakhstan (79.7%, a difference of 0.0%), Immigrants from South Africa (79.7%, a difference of 0.0%), Senegalese (79.7%, a difference of 0.0%), Immigrants from China (79.7%, a difference of 0.0%), and Immigrants from Northern Europe (79.7%, a difference of 0.020%).
| Demographics | Rating | Rank | In Labor Force | Age 20-64 |
| Immigrants | Philippines | 78.0 /100 | #147 | Good 79.8% |
| Romanians | 77.6 /100 | #148 | Good 79.8% |
| Icelanders | 75.1 /100 | #149 | Good 79.7% |
| Costa Ricans | 72.4 /100 | #150 | Good 79.7% |
| Scandinavians | 72.0 /100 | #151 | Good 79.7% |
| Immigrants | Northern Europe | 72.0 /100 | #152 | Good 79.7% |
| Immigrants | Kazakhstan | 69.5 /100 | #153 | Good 79.7% |
| New Zealanders | 69.4 /100 | #154 | Good 79.7% |
| Immigrants | South Africa | 69.2 /100 | #155 | Good 79.7% |
| Senegalese | 69.1 /100 | #156 | Good 79.7% |
| Immigrants | China | 69.1 /100 | #157 | Good 79.7% |
| Austrians | 67.6 /100 | #158 | Good 79.7% |
| Immigrants | Cuba | 66.7 /100 | #159 | Good 79.7% |
| Moroccans | 66.7 /100 | #160 | Good 79.7% |
| South Africans | 66.2 /100 | #161 | Good 79.7% |