Immigrants from the Azores vs New Zealander Disability Age 35 to 64
COMPARE
Immigrants from the Azores
New Zealander
Disability Age 35 to 64
Disability Age 35 to 64 Comparison
Immigrants from the Azores
New Zealanders
14.3%
DISABILITY AGE 35 TO 64
0.0/ 100
METRIC RATING
311th/ 347
METRIC RANK
11.0%
DISABILITY AGE 35 TO 64
79.3/ 100
METRIC RATING
151st/ 347
METRIC RANK
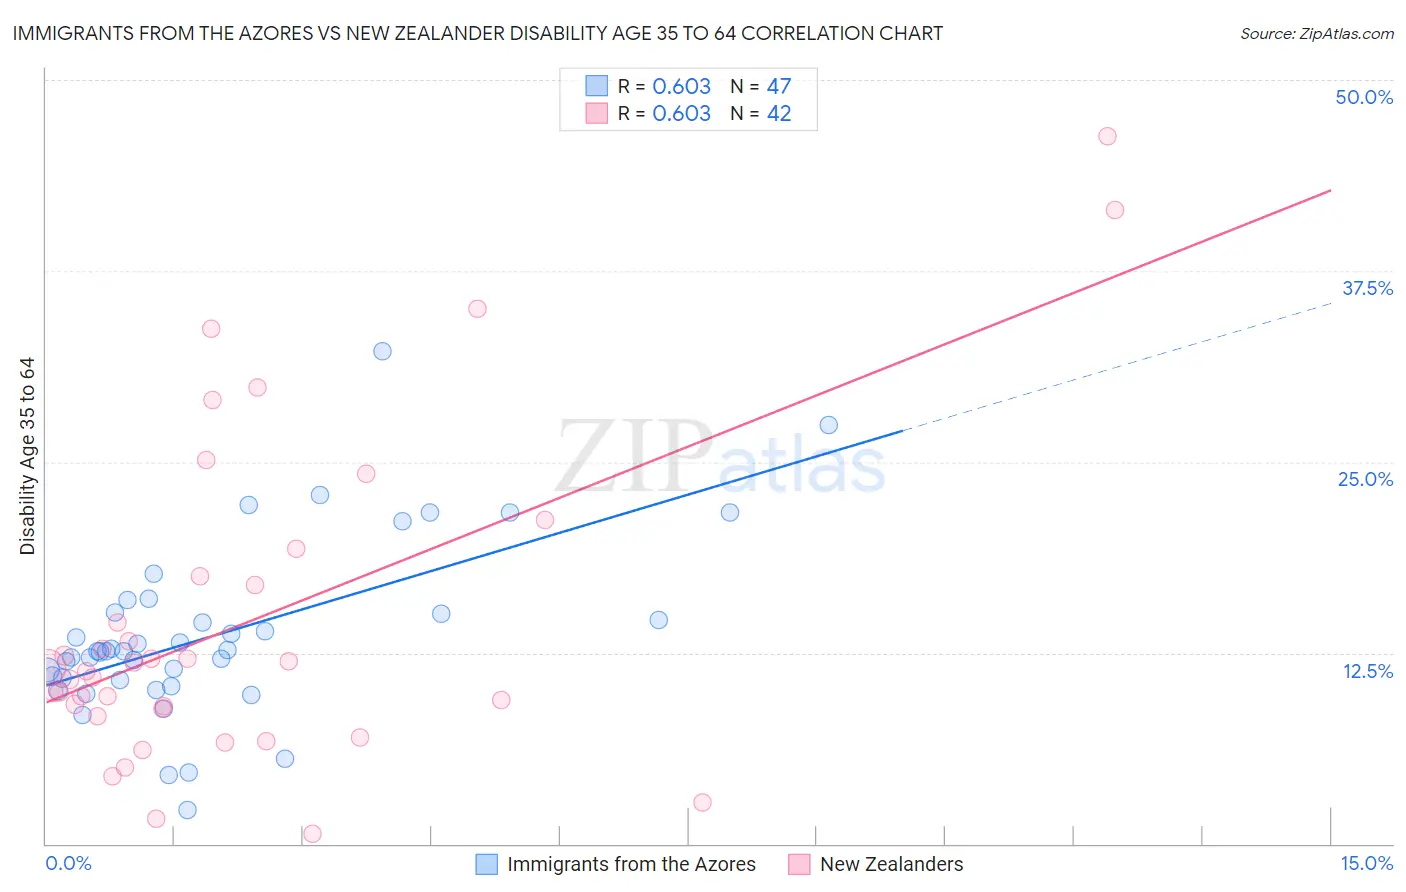
Immigrants from the Azores vs New Zealander Disability Age 35 to 64 Correlation Chart
The statistical analysis conducted on geographies consisting of 46,256,915 people shows a significant positive correlation between the proportion of Immigrants from the Azores and percentage of population with a disability between the ages 34 and 64 in the United States with a correlation coefficient (R) of 0.603 and weighted average of 14.3%. Similarly, the statistical analysis conducted on geographies consisting of 106,896,274 people shows a significant positive correlation between the proportion of New Zealanders and percentage of population with a disability between the ages 34 and 64 in the United States with a correlation coefficient (R) of 0.603 and weighted average of 11.0%, a difference of 30.1%.
Disability Age 35 to 64 Correlation Summary
| Measurement | Immigrants from the Azores | New Zealander |
| Minimum | 2.2% | 0.65% |
| Maximum | 32.2% | 46.3% |
| Range | 30.0% | 45.6% |
| Mean | 13.7% | 14.5% |
| Median | 12.6% | 11.4% |
| Interquartile 25% (IQ1) | 10.7% | 8.8% |
| Interquartile 75% (IQ3) | 15.2% | 17.5% |
| Interquartile Range (IQR) | 4.5% | 8.7% |
| Standard Deviation (Sample) | 5.7% | 10.5% |
| Standard Deviation (Population) | 5.7% | 10.4% |
Similar Demographics by Disability Age 35 to 64
Demographics Similar to Immigrants from the Azores by Disability Age 35 to 64
In terms of disability age 35 to 64, the demographic groups most similar to Immigrants from the Azores are Paiute (14.3%, a difference of 0.15%), Iroquois (14.4%, a difference of 0.58%), Cape Verdean (14.1%, a difference of 0.92%), Shoshone (14.5%, a difference of 1.3%), and Alaska Native (14.5%, a difference of 1.4%).
| Demographics | Rating | Rank | Disability Age 35 to 64 |
| Hopi | 0.0 /100 | #304 | Tragic 13.9% |
| Americans | 0.0 /100 | #305 | Tragic 13.9% |
| Immigrants | Yemen | 0.0 /100 | #306 | Tragic 14.0% |
| Blackfeet | 0.0 /100 | #307 | Tragic 14.1% |
| Inupiat | 0.0 /100 | #308 | Tragic 14.1% |
| Cree | 0.0 /100 | #309 | Tragic 14.1% |
| Cape Verdeans | 0.0 /100 | #310 | Tragic 14.1% |
| Immigrants | Azores | 0.0 /100 | #311 | Tragic 14.3% |
| Paiute | 0.0 /100 | #312 | Tragic 14.3% |
| Iroquois | 0.0 /100 | #313 | Tragic 14.4% |
| Shoshone | 0.0 /100 | #314 | Tragic 14.5% |
| Alaska Natives | 0.0 /100 | #315 | Tragic 14.5% |
| Osage | 0.0 /100 | #316 | Tragic 14.5% |
| Crow | 0.0 /100 | #317 | Tragic 14.6% |
| Ottawa | 0.0 /100 | #318 | Tragic 14.6% |
Demographics Similar to New Zealanders by Disability Age 35 to 64
In terms of disability age 35 to 64, the demographic groups most similar to New Zealanders are Syrian (11.0%, a difference of 0.060%), Ukrainian (11.0%, a difference of 0.16%), Immigrants from Cameroon (10.9%, a difference of 0.24%), Immigrants from England (11.0%, a difference of 0.24%), and Immigrants from Canada (11.0%, a difference of 0.31%).
| Demographics | Rating | Rank | Disability Age 35 to 64 |
| Lithuanians | 88.7 /100 | #144 | Excellent 10.8% |
| Immigrants | Bangladesh | 85.6 /100 | #145 | Excellent 10.9% |
| South American Indians | 83.5 /100 | #146 | Excellent 10.9% |
| Immigrants | Eritrea | 83.4 /100 | #147 | Excellent 10.9% |
| Arabs | 82.7 /100 | #148 | Excellent 10.9% |
| Immigrants | Cameroon | 81.1 /100 | #149 | Excellent 10.9% |
| Syrians | 79.8 /100 | #150 | Good 11.0% |
| New Zealanders | 79.3 /100 | #151 | Good 11.0% |
| Ukrainians | 78.0 /100 | #152 | Good 11.0% |
| Immigrants | England | 77.4 /100 | #153 | Good 11.0% |
| Immigrants | Canada | 76.7 /100 | #154 | Good 11.0% |
| Moroccans | 76.4 /100 | #155 | Good 11.0% |
| Immigrants | Sierra Leone | 76.2 /100 | #156 | Good 11.0% |
| Guyanese | 75.1 /100 | #157 | Good 11.0% |
| Immigrants | North America | 74.9 /100 | #158 | Good 11.0% |