Lithuanian vs White/Caucasian In Labor Force | Age 25-29
COMPARE
Lithuanian
White/Caucasian
In Labor Force | Age 25-29
In Labor Force | Age 25-29 Comparison
Lithuanians
Whites/Caucasians
85.8%
IN LABOR FORCE | AGE 25-29
99.9/ 100
METRIC RATING
34th/ 347
METRIC RANK
84.2%
IN LABOR FORCE | AGE 25-29
4.8/ 100
METRIC RATING
230th/ 347
METRIC RANK
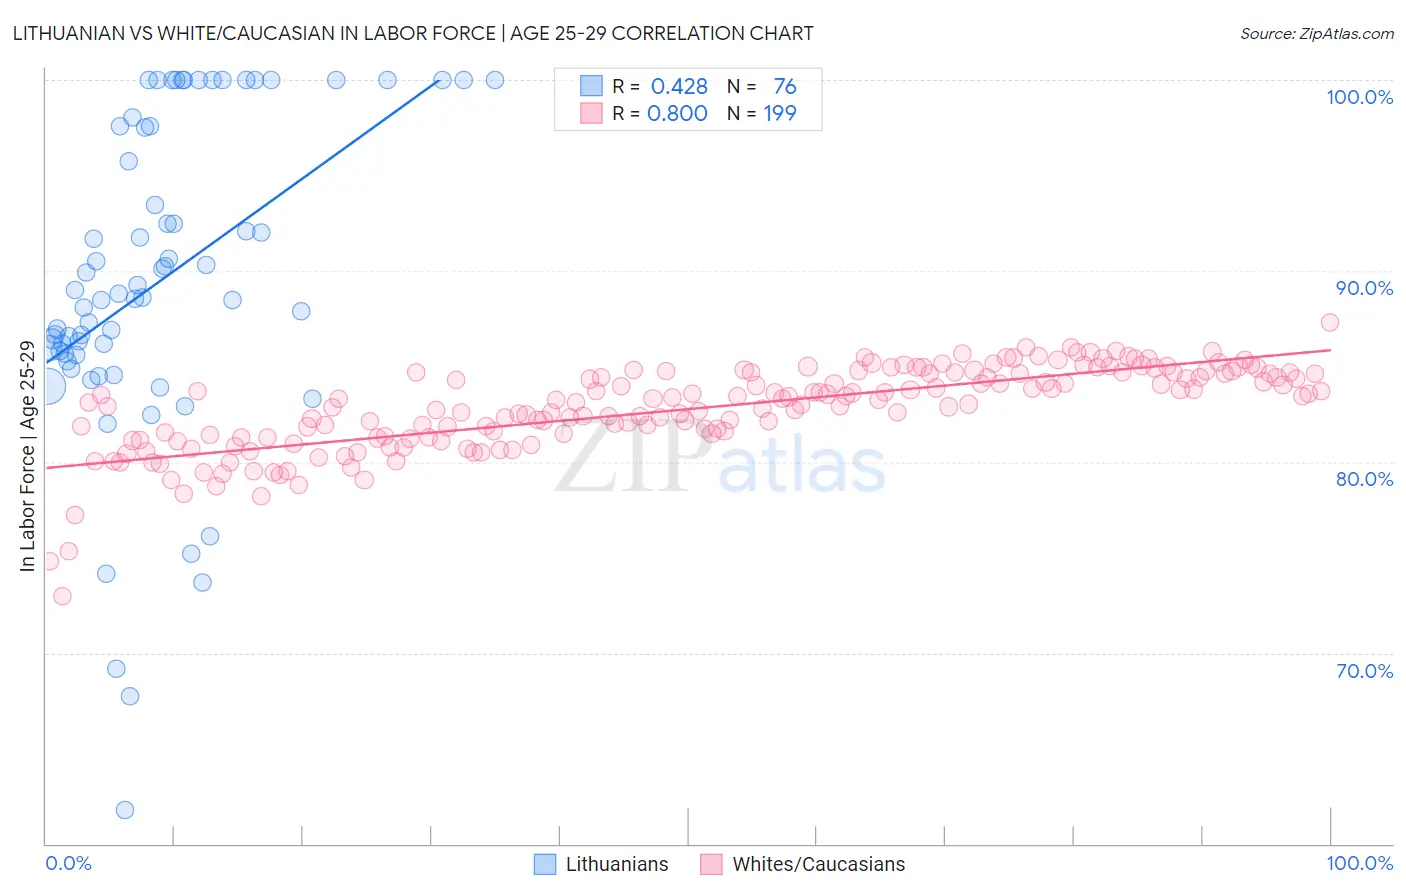
Lithuanian vs White/Caucasian In Labor Force | Age 25-29 Correlation Chart
The statistical analysis conducted on geographies consisting of 421,659,157 people shows a moderate positive correlation between the proportion of Lithuanians and labor force participation rate among population between the ages 25 and 29 in the United States with a correlation coefficient (R) of 0.428 and weighted average of 85.8%. Similarly, the statistical analysis conducted on geographies consisting of 582,492,747 people shows a strong positive correlation between the proportion of Whites/Caucasians and labor force participation rate among population between the ages 25 and 29 in the United States with a correlation coefficient (R) of 0.800 and weighted average of 84.2%, a difference of 1.9%.
In Labor Force | Age 25-29 Correlation Summary
| Measurement | Lithuanian | White/Caucasian |
| Minimum | 61.7% | 73.0% |
| Maximum | 100.0% | 87.3% |
| Range | 38.3% | 14.3% |
| Mean | 89.5% | 82.8% |
| Median | 88.7% | 83.2% |
| Interquartile 25% (IQ1) | 85.6% | 81.3% |
| Interquartile 75% (IQ3) | 97.6% | 84.6% |
| Interquartile Range (IQR) | 11.9% | 3.3% |
| Standard Deviation (Sample) | 8.4% | 2.2% |
| Standard Deviation (Population) | 8.3% | 2.2% |
Similar Demographics by In Labor Force | Age 25-29
Demographics Similar to Lithuanians by In Labor Force | Age 25-29
In terms of in labor force | age 25-29, the demographic groups most similar to Lithuanians are Cypriot (85.8%, a difference of 0.010%), Immigrants from Nepal (85.8%, a difference of 0.010%), German Russian (85.8%, a difference of 0.030%), Slovak (85.8%, a difference of 0.030%), and Immigrants from Bulgaria (85.8%, a difference of 0.030%).
| Demographics | Rating | Rank | In Labor Force | Age 25-29 |
| Paraguayans | 100.0 /100 | #27 | Exceptional 85.9% |
| Ugandans | 100.0 /100 | #28 | Exceptional 85.9% |
| Immigrants | Liberia | 100.0 /100 | #29 | Exceptional 85.9% |
| Immigrants | Serbia | 100.0 /100 | #30 | Exceptional 85.9% |
| German Russians | 100.0 /100 | #31 | Exceptional 85.8% |
| Slovaks | 100.0 /100 | #32 | Exceptional 85.8% |
| Immigrants | Bulgaria | 100.0 /100 | #33 | Exceptional 85.8% |
| Lithuanians | 99.9 /100 | #34 | Exceptional 85.8% |
| Cypriots | 99.9 /100 | #35 | Exceptional 85.8% |
| Immigrants | Nepal | 99.9 /100 | #36 | Exceptional 85.8% |
| Poles | 99.9 /100 | #37 | Exceptional 85.8% |
| Sierra Leoneans | 99.9 /100 | #38 | Exceptional 85.8% |
| Croatians | 99.9 /100 | #39 | Exceptional 85.8% |
| Immigrants | Albania | 99.9 /100 | #40 | Exceptional 85.7% |
| Immigrants | Greece | 99.9 /100 | #41 | Exceptional 85.7% |
Demographics Similar to Whites/Caucasians by In Labor Force | Age 25-29
In terms of in labor force | age 25-29, the demographic groups most similar to Whites/Caucasians are Immigrants from Oceania (84.2%, a difference of 0.0%), Immigrants from Philippines (84.2%, a difference of 0.010%), Panamanian (84.2%, a difference of 0.010%), French American Indian (84.2%, a difference of 0.020%), and Immigrants from Panama (84.2%, a difference of 0.020%).
| Demographics | Rating | Rank | In Labor Force | Age 25-29 |
| Scotch-Irish | 6.5 /100 | #223 | Tragic 84.2% |
| Immigrants | West Indies | 6.0 /100 | #224 | Tragic 84.2% |
| Koreans | 5.9 /100 | #225 | Tragic 84.2% |
| Immigrants | Congo | 5.8 /100 | #226 | Tragic 84.2% |
| French American Indians | 5.5 /100 | #227 | Tragic 84.2% |
| Immigrants | Panama | 5.5 /100 | #228 | Tragic 84.2% |
| Immigrants | Oceania | 5.0 /100 | #229 | Tragic 84.2% |
| Whites/Caucasians | 4.8 /100 | #230 | Tragic 84.2% |
| Immigrants | Philippines | 4.7 /100 | #231 | Tragic 84.2% |
| Panamanians | 4.5 /100 | #232 | Tragic 84.2% |
| Immigrants | Western Asia | 2.7 /100 | #233 | Tragic 84.1% |
| Barbadians | 1.0 /100 | #234 | Tragic 83.9% |
| Iraqis | 0.9 /100 | #235 | Tragic 83.9% |
| Guamanians/Chamorros | 0.9 /100 | #236 | Tragic 83.9% |
| Immigrants | Immigrants | 0.9 /100 | #237 | Tragic 83.9% |