Immigrants from Austria vs Immigrants from Ecuador In Labor Force | Age 25-29
COMPARE
Immigrants from Austria
Immigrants from Ecuador
In Labor Force | Age 25-29
In Labor Force | Age 25-29 Comparison
Immigrants from Austria
Immigrants from Ecuador
85.0%
IN LABOR FORCE | AGE 25-29
91.9/ 100
METRIC RATING
108th/ 347
METRIC RANK
84.3%
IN LABOR FORCE | AGE 25-29
9.3/ 100
METRIC RATING
217th/ 347
METRIC RANK
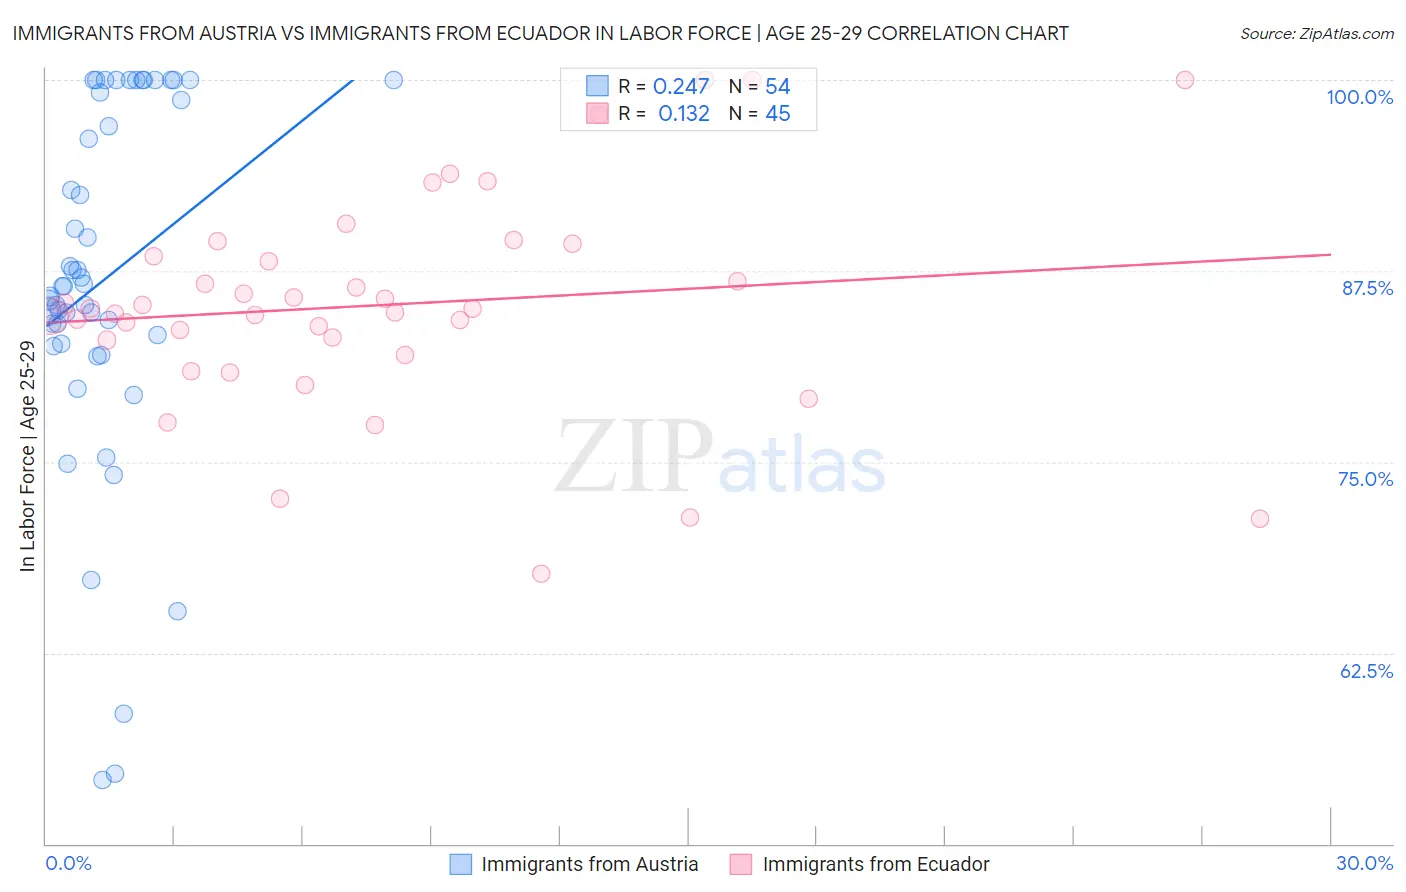
Immigrants from Austria vs Immigrants from Ecuador In Labor Force | Age 25-29 Correlation Chart
The statistical analysis conducted on geographies consisting of 167,922,363 people shows a weak positive correlation between the proportion of Immigrants from Austria and labor force participation rate among population between the ages 25 and 29 in the United States with a correlation coefficient (R) of 0.247 and weighted average of 85.0%. Similarly, the statistical analysis conducted on geographies consisting of 270,970,556 people shows a poor positive correlation between the proportion of Immigrants from Ecuador and labor force participation rate among population between the ages 25 and 29 in the United States with a correlation coefficient (R) of 0.132 and weighted average of 84.3%, a difference of 0.87%.
In Labor Force | Age 25-29 Correlation Summary
| Measurement | Immigrants from Austria | Immigrants from Ecuador |
| Minimum | 54.2% | 67.7% |
| Maximum | 100.0% | 100.0% |
| Range | 45.8% | 32.3% |
| Mean | 87.0% | 85.3% |
| Median | 86.5% | 85.0% |
| Interquartile 25% (IQ1) | 82.7% | 82.5% |
| Interquartile 75% (IQ3) | 99.2% | 88.9% |
| Interquartile Range (IQR) | 16.4% | 6.4% |
| Standard Deviation (Sample) | 11.7% | 7.1% |
| Standard Deviation (Population) | 11.6% | 7.0% |
Similar Demographics by In Labor Force | Age 25-29
Demographics Similar to Immigrants from Austria by In Labor Force | Age 25-29
In terms of in labor force | age 25-29, the demographic groups most similar to Immigrants from Austria are Costa Rican (85.0%, a difference of 0.0%), Immigrants from Southern Europe (85.0%, a difference of 0.010%), New Zealander (85.0%, a difference of 0.010%), Immigrants from Middle Africa (85.0%, a difference of 0.010%), and Immigrants from Hong Kong (85.0%, a difference of 0.020%).
| Demographics | Rating | Rank | In Labor Force | Age 25-29 |
| Egyptians | 93.8 /100 | #101 | Exceptional 85.1% |
| Slavs | 93.7 /100 | #102 | Exceptional 85.1% |
| Immigrants | Japan | 93.5 /100 | #103 | Exceptional 85.1% |
| Immigrants | Zaire | 93.3 /100 | #104 | Exceptional 85.1% |
| Immigrants | Hong Kong | 92.8 /100 | #105 | Exceptional 85.0% |
| Czechoslovakians | 92.6 /100 | #106 | Exceptional 85.0% |
| Immigrants | Southern Europe | 92.3 /100 | #107 | Exceptional 85.0% |
| Immigrants | Austria | 91.9 /100 | #108 | Exceptional 85.0% |
| Costa Ricans | 91.9 /100 | #109 | Exceptional 85.0% |
| New Zealanders | 91.5 /100 | #110 | Exceptional 85.0% |
| Immigrants | Middle Africa | 91.4 /100 | #111 | Exceptional 85.0% |
| Senegalese | 90.9 /100 | #112 | Exceptional 85.0% |
| Irish | 90.6 /100 | #113 | Exceptional 85.0% |
| Immigrants | Malaysia | 90.4 /100 | #114 | Exceptional 85.0% |
| South Africans | 88.9 /100 | #115 | Excellent 85.0% |
Demographics Similar to Immigrants from Ecuador by In Labor Force | Age 25-29
In terms of in labor force | age 25-29, the demographic groups most similar to Immigrants from Ecuador are Israeli (84.3%, a difference of 0.0%), Immigrants from Nigeria (84.3%, a difference of 0.010%), Immigrants from Saudi Arabia (84.3%, a difference of 0.010%), Immigrants from Syria (84.3%, a difference of 0.030%), and Japanese (84.3%, a difference of 0.040%).
| Demographics | Rating | Rank | In Labor Force | Age 25-29 |
| Chinese | 12.7 /100 | #210 | Poor 84.3% |
| Immigrants | Venezuela | 12.6 /100 | #211 | Poor 84.3% |
| Sub-Saharan Africans | 11.7 /100 | #212 | Poor 84.3% |
| Japanese | 11.4 /100 | #213 | Poor 84.3% |
| Lebanese | 11.1 /100 | #214 | Poor 84.3% |
| Immigrants | Syria | 10.7 /100 | #215 | Poor 84.3% |
| Israelis | 9.3 /100 | #216 | Tragic 84.3% |
| Immigrants | Ecuador | 9.3 /100 | #217 | Tragic 84.3% |
| Immigrants | Nigeria | 9.0 /100 | #218 | Tragic 84.3% |
| Immigrants | Saudi Arabia | 8.8 /100 | #219 | Tragic 84.3% |
| Nigerians | 7.2 /100 | #220 | Tragic 84.3% |
| Arabs | 6.8 /100 | #221 | Tragic 84.2% |
| Jordanians | 6.7 /100 | #222 | Tragic 84.2% |
| Scotch-Irish | 6.5 /100 | #223 | Tragic 84.2% |
| Immigrants | West Indies | 6.0 /100 | #224 | Tragic 84.2% |