Immigrants from Austria vs Immigrants from Venezuela In Labor Force | Age 25-29
COMPARE
Immigrants from Austria
Immigrants from Venezuela
In Labor Force | Age 25-29
In Labor Force | Age 25-29 Comparison
Immigrants from Austria
Immigrants from Venezuela
85.0%
IN LABOR FORCE | AGE 25-29
91.9/ 100
METRIC RATING
108th/ 347
METRIC RANK
84.3%
IN LABOR FORCE | AGE 25-29
12.6/ 100
METRIC RATING
211th/ 347
METRIC RANK
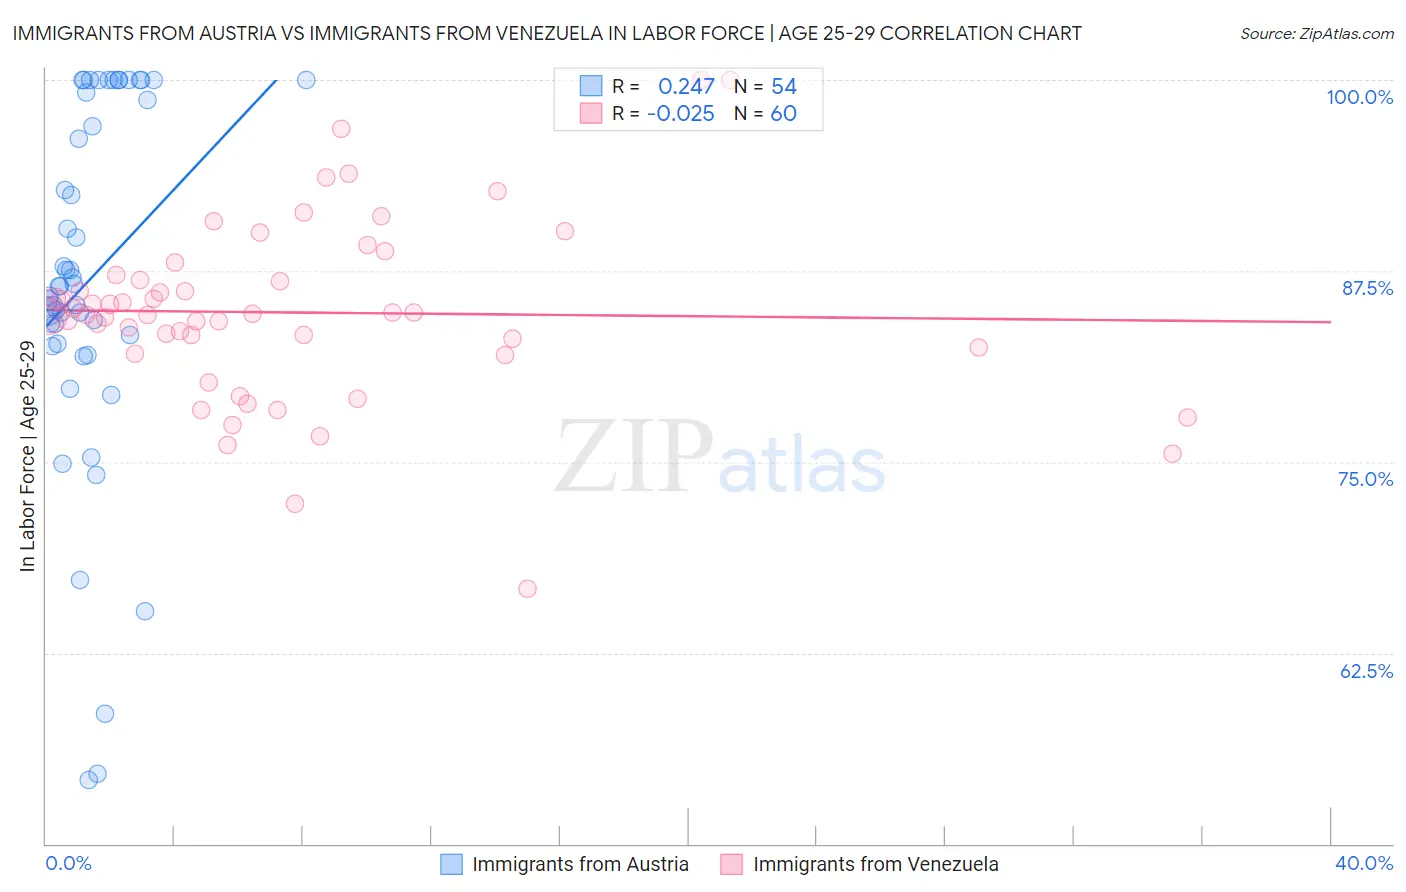
Immigrants from Austria vs Immigrants from Venezuela In Labor Force | Age 25-29 Correlation Chart
The statistical analysis conducted on geographies consisting of 167,922,363 people shows a weak positive correlation between the proportion of Immigrants from Austria and labor force participation rate among population between the ages 25 and 29 in the United States with a correlation coefficient (R) of 0.247 and weighted average of 85.0%. Similarly, the statistical analysis conducted on geographies consisting of 287,835,027 people shows no correlation between the proportion of Immigrants from Venezuela and labor force participation rate among population between the ages 25 and 29 in the United States with a correlation coefficient (R) of -0.025 and weighted average of 84.3%, a difference of 0.81%.
In Labor Force | Age 25-29 Correlation Summary
| Measurement | Immigrants from Austria | Immigrants from Venezuela |
| Minimum | 54.2% | 66.7% |
| Maximum | 100.0% | 100.0% |
| Range | 45.8% | 33.3% |
| Mean | 87.0% | 84.8% |
| Median | 86.5% | 84.7% |
| Interquartile 25% (IQ1) | 82.7% | 82.3% |
| Interquartile 75% (IQ3) | 99.2% | 87.1% |
| Interquartile Range (IQR) | 16.4% | 4.8% |
| Standard Deviation (Sample) | 11.7% | 6.0% |
| Standard Deviation (Population) | 11.6% | 5.9% |
Similar Demographics by In Labor Force | Age 25-29
Demographics Similar to Immigrants from Austria by In Labor Force | Age 25-29
In terms of in labor force | age 25-29, the demographic groups most similar to Immigrants from Austria are Costa Rican (85.0%, a difference of 0.0%), Immigrants from Southern Europe (85.0%, a difference of 0.010%), New Zealander (85.0%, a difference of 0.010%), Immigrants from Middle Africa (85.0%, a difference of 0.010%), and Immigrants from Hong Kong (85.0%, a difference of 0.020%).
| Demographics | Rating | Rank | In Labor Force | Age 25-29 |
| Egyptians | 93.8 /100 | #101 | Exceptional 85.1% |
| Slavs | 93.7 /100 | #102 | Exceptional 85.1% |
| Immigrants | Japan | 93.5 /100 | #103 | Exceptional 85.1% |
| Immigrants | Zaire | 93.3 /100 | #104 | Exceptional 85.1% |
| Immigrants | Hong Kong | 92.8 /100 | #105 | Exceptional 85.0% |
| Czechoslovakians | 92.6 /100 | #106 | Exceptional 85.0% |
| Immigrants | Southern Europe | 92.3 /100 | #107 | Exceptional 85.0% |
| Immigrants | Austria | 91.9 /100 | #108 | Exceptional 85.0% |
| Costa Ricans | 91.9 /100 | #109 | Exceptional 85.0% |
| New Zealanders | 91.5 /100 | #110 | Exceptional 85.0% |
| Immigrants | Middle Africa | 91.4 /100 | #111 | Exceptional 85.0% |
| Senegalese | 90.9 /100 | #112 | Exceptional 85.0% |
| Irish | 90.6 /100 | #113 | Exceptional 85.0% |
| Immigrants | Malaysia | 90.4 /100 | #114 | Exceptional 85.0% |
| South Africans | 88.9 /100 | #115 | Excellent 85.0% |
Demographics Similar to Immigrants from Venezuela by In Labor Force | Age 25-29
In terms of in labor force | age 25-29, the demographic groups most similar to Immigrants from Venezuela are Immigrants from Jordan (84.4%, a difference of 0.0%), Chinese (84.3%, a difference of 0.0%), Immigrants from Armenia (84.4%, a difference of 0.010%), Immigrants from Indonesia (84.4%, a difference of 0.010%), and Subsaharan African (84.3%, a difference of 0.020%).
| Demographics | Rating | Rank | In Labor Force | Age 25-29 |
| Venezuelans | 15.1 /100 | #204 | Poor 84.4% |
| Ecuadorians | 14.8 /100 | #205 | Poor 84.4% |
| Immigrants | Cambodia | 14.3 /100 | #206 | Poor 84.4% |
| Immigrants | Armenia | 13.3 /100 | #207 | Poor 84.4% |
| Immigrants | Indonesia | 13.2 /100 | #208 | Poor 84.4% |
| Immigrants | Jordan | 12.8 /100 | #209 | Poor 84.4% |
| Chinese | 12.7 /100 | #210 | Poor 84.3% |
| Immigrants | Venezuela | 12.6 /100 | #211 | Poor 84.3% |
| Sub-Saharan Africans | 11.7 /100 | #212 | Poor 84.3% |
| Japanese | 11.4 /100 | #213 | Poor 84.3% |
| Lebanese | 11.1 /100 | #214 | Poor 84.3% |
| Immigrants | Syria | 10.7 /100 | #215 | Poor 84.3% |
| Israelis | 9.3 /100 | #216 | Tragic 84.3% |
| Immigrants | Ecuador | 9.3 /100 | #217 | Tragic 84.3% |
| Immigrants | Nigeria | 9.0 /100 | #218 | Tragic 84.3% |