Immigrants from Africa vs Immigrants from Eritrea In Labor Force | Age 30-34
COMPARE
Immigrants from Africa
Immigrants from Eritrea
In Labor Force | Age 30-34
In Labor Force | Age 30-34 Comparison
Immigrants from Africa
Immigrants from Eritrea
85.3%
IN LABOR FORCE | AGE 30-34
98.6/ 100
METRIC RATING
82nd/ 347
METRIC RANK
85.9%
IN LABOR FORCE | AGE 30-34
100.0/ 100
METRIC RATING
24th/ 347
METRIC RANK
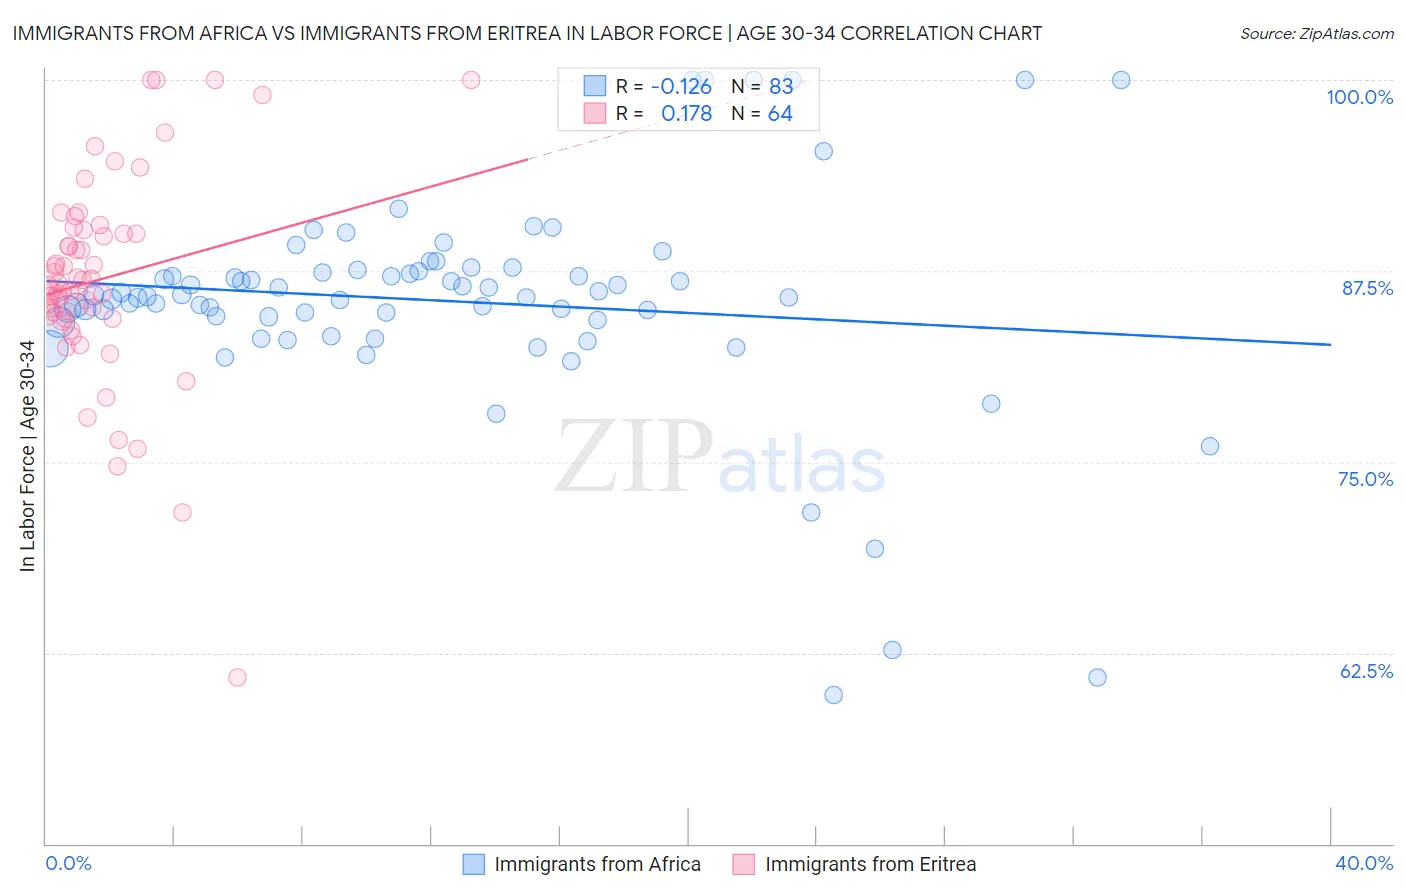
Immigrants from Africa vs Immigrants from Eritrea In Labor Force | Age 30-34 Correlation Chart
The statistical analysis conducted on geographies consisting of 469,010,548 people shows a poor negative correlation between the proportion of Immigrants from Africa and labor force participation rate among population between the ages 30 and 34 in the United States with a correlation coefficient (R) of -0.126 and weighted average of 85.3%. Similarly, the statistical analysis conducted on geographies consisting of 104,841,565 people shows a poor positive correlation between the proportion of Immigrants from Eritrea and labor force participation rate among population between the ages 30 and 34 in the United States with a correlation coefficient (R) of 0.178 and weighted average of 85.9%, a difference of 0.72%.
In Labor Force | Age 30-34 Correlation Summary
| Measurement | Immigrants from Africa | Immigrants from Eritrea |
| Minimum | 59.7% | 60.9% |
| Maximum | 100.0% | 100.0% |
| Range | 40.3% | 39.1% |
| Mean | 85.5% | 87.0% |
| Median | 85.8% | 86.6% |
| Interquartile 25% (IQ1) | 84.3% | 84.6% |
| Interquartile 75% (IQ3) | 87.5% | 90.1% |
| Interquartile Range (IQR) | 3.2% | 5.5% |
| Standard Deviation (Sample) | 7.1% | 6.8% |
| Standard Deviation (Population) | 7.1% | 6.7% |
Similar Demographics by In Labor Force | Age 30-34
Demographics Similar to Immigrants from Africa by In Labor Force | Age 30-34
In terms of in labor force | age 30-34, the demographic groups most similar to Immigrants from Africa are Immigrants from Switzerland (85.3%, a difference of 0.010%), Immigrants from Russia (85.3%, a difference of 0.010%), Slovak (85.3%, a difference of 0.010%), Immigrants from Europe (85.3%, a difference of 0.010%), and Greek (85.3%, a difference of 0.010%).
| Demographics | Rating | Rank | In Labor Force | Age 30-34 |
| Immigrants | Czechoslovakia | 99.0 /100 | #75 | Exceptional 85.4% |
| Iranians | 99.0 /100 | #76 | Exceptional 85.4% |
| Immigrants | Eastern Asia | 98.9 /100 | #77 | Exceptional 85.4% |
| Immigrants | Singapore | 98.8 /100 | #78 | Exceptional 85.3% |
| Immigrants | Switzerland | 98.7 /100 | #79 | Exceptional 85.3% |
| Immigrants | Russia | 98.7 /100 | #80 | Exceptional 85.3% |
| Slovaks | 98.7 /100 | #81 | Exceptional 85.3% |
| Immigrants | Africa | 98.6 /100 | #82 | Exceptional 85.3% |
| Immigrants | Europe | 98.6 /100 | #83 | Exceptional 85.3% |
| Greeks | 98.6 /100 | #84 | Exceptional 85.3% |
| Mongolians | 98.5 /100 | #85 | Exceptional 85.3% |
| Immigrants | Taiwan | 98.3 /100 | #86 | Exceptional 85.3% |
| Immigrants | Northern Europe | 98.2 /100 | #87 | Exceptional 85.3% |
| Immigrants | Belgium | 98.2 /100 | #88 | Exceptional 85.3% |
| Immigrants | Kazakhstan | 98.1 /100 | #89 | Exceptional 85.3% |
Demographics Similar to Immigrants from Eritrea by In Labor Force | Age 30-34
In terms of in labor force | age 30-34, the demographic groups most similar to Immigrants from Eritrea are Bermudan (85.9%, a difference of 0.010%), Estonian (85.9%, a difference of 0.010%), Immigrants from North Macedonia (85.9%, a difference of 0.010%), Immigrants from Eastern Africa (85.9%, a difference of 0.020%), and Immigrants from Liberia (85.9%, a difference of 0.030%).
| Demographics | Rating | Rank | In Labor Force | Age 30-34 |
| Immigrants | Cameroon | 100.0 /100 | #17 | Exceptional 86.0% |
| Immigrants | Sierra Leone | 100.0 /100 | #18 | Exceptional 86.0% |
| Sierra Leoneans | 100.0 /100 | #19 | Exceptional 86.0% |
| Bulgarians | 100.0 /100 | #20 | Exceptional 86.0% |
| Immigrants | Bulgaria | 100.0 /100 | #21 | Exceptional 86.0% |
| Bermudans | 100.0 /100 | #22 | Exceptional 85.9% |
| Estonians | 100.0 /100 | #23 | Exceptional 85.9% |
| Immigrants | Eritrea | 100.0 /100 | #24 | Exceptional 85.9% |
| Immigrants | North Macedonia | 100.0 /100 | #25 | Exceptional 85.9% |
| Immigrants | Eastern Africa | 100.0 /100 | #26 | Exceptional 85.9% |
| Immigrants | Liberia | 100.0 /100 | #27 | Exceptional 85.9% |
| Immigrants | Latvia | 100.0 /100 | #28 | Exceptional 85.9% |
| Tsimshian | 100.0 /100 | #29 | Exceptional 85.8% |
| Immigrants | Hong Kong | 100.0 /100 | #30 | Exceptional 85.8% |
| Paraguayans | 99.9 /100 | #31 | Exceptional 85.8% |