Immigrants from Africa vs South American Indian In Labor Force | Age 30-34
COMPARE
Immigrants from Africa
South American Indian
In Labor Force | Age 30-34
In Labor Force | Age 30-34 Comparison
Immigrants from Africa
South American Indians
85.3%
IN LABOR FORCE | AGE 30-34
98.6/ 100
METRIC RATING
82nd/ 347
METRIC RANK
84.7%
IN LABOR FORCE | AGE 30-34
52.1/ 100
METRIC RATING
169th/ 347
METRIC RANK
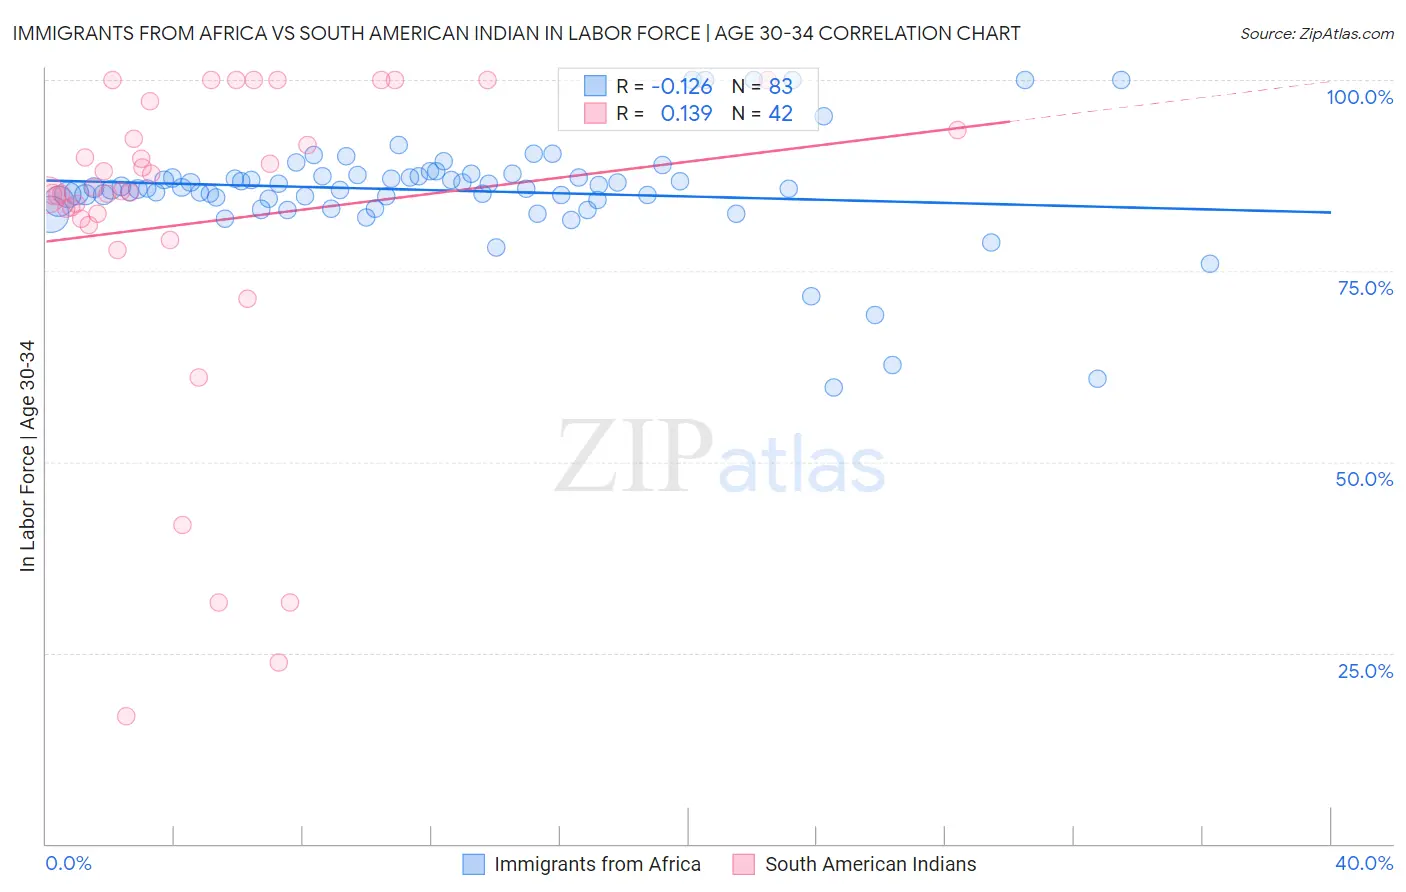
Immigrants from Africa vs South American Indian In Labor Force | Age 30-34 Correlation Chart
The statistical analysis conducted on geographies consisting of 469,010,548 people shows a poor negative correlation between the proportion of Immigrants from Africa and labor force participation rate among population between the ages 30 and 34 in the United States with a correlation coefficient (R) of -0.126 and weighted average of 85.3%. Similarly, the statistical analysis conducted on geographies consisting of 164,535,874 people shows a poor positive correlation between the proportion of South American Indians and labor force participation rate among population between the ages 30 and 34 in the United States with a correlation coefficient (R) of 0.139 and weighted average of 84.7%, a difference of 0.74%.
In Labor Force | Age 30-34 Correlation Summary
| Measurement | Immigrants from Africa | South American Indian |
| Minimum | 59.7% | 16.7% |
| Maximum | 100.0% | 100.0% |
| Range | 40.3% | 83.3% |
| Mean | 85.5% | 81.4% |
| Median | 85.8% | 85.3% |
| Interquartile 25% (IQ1) | 84.3% | 81.8% |
| Interquartile 75% (IQ3) | 87.5% | 93.5% |
| Interquartile Range (IQR) | 3.2% | 11.7% |
| Standard Deviation (Sample) | 7.1% | 21.4% |
| Standard Deviation (Population) | 7.1% | 21.1% |
Similar Demographics by In Labor Force | Age 30-34
Demographics Similar to Immigrants from Africa by In Labor Force | Age 30-34
In terms of in labor force | age 30-34, the demographic groups most similar to Immigrants from Africa are Immigrants from Switzerland (85.3%, a difference of 0.010%), Immigrants from Russia (85.3%, a difference of 0.010%), Slovak (85.3%, a difference of 0.010%), Immigrants from Europe (85.3%, a difference of 0.010%), and Greek (85.3%, a difference of 0.010%).
| Demographics | Rating | Rank | In Labor Force | Age 30-34 |
| Immigrants | Czechoslovakia | 99.0 /100 | #75 | Exceptional 85.4% |
| Iranians | 99.0 /100 | #76 | Exceptional 85.4% |
| Immigrants | Eastern Asia | 98.9 /100 | #77 | Exceptional 85.4% |
| Immigrants | Singapore | 98.8 /100 | #78 | Exceptional 85.3% |
| Immigrants | Switzerland | 98.7 /100 | #79 | Exceptional 85.3% |
| Immigrants | Russia | 98.7 /100 | #80 | Exceptional 85.3% |
| Slovaks | 98.7 /100 | #81 | Exceptional 85.3% |
| Immigrants | Africa | 98.6 /100 | #82 | Exceptional 85.3% |
| Immigrants | Europe | 98.6 /100 | #83 | Exceptional 85.3% |
| Greeks | 98.6 /100 | #84 | Exceptional 85.3% |
| Mongolians | 98.5 /100 | #85 | Exceptional 85.3% |
| Immigrants | Taiwan | 98.3 /100 | #86 | Exceptional 85.3% |
| Immigrants | Northern Europe | 98.2 /100 | #87 | Exceptional 85.3% |
| Immigrants | Belgium | 98.2 /100 | #88 | Exceptional 85.3% |
| Immigrants | Kazakhstan | 98.1 /100 | #89 | Exceptional 85.3% |
Demographics Similar to South American Indians by In Labor Force | Age 30-34
In terms of in labor force | age 30-34, the demographic groups most similar to South American Indians are Immigrants from Peru (84.7%, a difference of 0.0%), Immigrants from Burma/Myanmar (84.7%, a difference of 0.0%), Irish (84.7%, a difference of 0.0%), Immigrants from England (84.7%, a difference of 0.0%), and Immigrants from South Eastern Asia (84.7%, a difference of 0.010%).
| Demographics | Rating | Rank | In Labor Force | Age 30-34 |
| South Americans | 58.7 /100 | #162 | Average 84.7% |
| Immigrants | Uruguay | 57.4 /100 | #163 | Average 84.7% |
| Icelanders | 56.8 /100 | #164 | Average 84.7% |
| Immigrants | Western Europe | 56.7 /100 | #165 | Average 84.7% |
| Afghans | 55.2 /100 | #166 | Average 84.7% |
| Immigrants | South Eastern Asia | 54.2 /100 | #167 | Average 84.7% |
| Immigrants | Peru | 52.4 /100 | #168 | Average 84.7% |
| South American Indians | 52.1 /100 | #169 | Average 84.7% |
| Immigrants | Burma/Myanmar | 52.0 /100 | #170 | Average 84.7% |
| Irish | 52.0 /100 | #171 | Average 84.7% |
| Immigrants | England | 51.7 /100 | #172 | Average 84.7% |
| Israelis | 51.1 /100 | #173 | Average 84.7% |
| Finns | 50.0 /100 | #174 | Average 84.7% |
| Immigrants | South America | 50.0 /100 | #175 | Average 84.7% |
| Immigrants | Uzbekistan | 49.1 /100 | #176 | Average 84.7% |