Immigrants from Afghanistan vs Slovak Kindergarten

COMPARE

Immigrants from Afghanistan
Race
Ancestry
AfghanAfricanAlaska NativeAlaskan AthabascanAlbanianAleutAlsatianAmericanApacheArabArapahoArgentineanArmenianAssyrian/Chaldean/SyriacAustralianAustrianBahamianBangladeshiBarbadianBasqueBelgianBelizeanBermudanBhutaneseBlackfeetBolivianBrazilianBritishBritish West IndianBulgarianBurmeseCajunCambodianCanadianCape VerdeanCarpatho RusynCelticCentral AmericanCentral American IndianCherokeeCheyenneChickasawChileanChineseChippewaChoctawColombianColvilleComancheCosta RicanCreeCreekCroatianCrowCubanCypriotCzechCzechoslovakianDanishDelawareDominicanDutchDutch West IndianEastern EuropeanEcuadorianEgyptianEnglishEstonianEthiopianEuropeanFijianFilipinoFinnishFrenchFrench American IndianFrench CanadianGermanGerman RussianGhanaianGreekGuamanian/ChamorroGuatemalanGuyaneseHaitianHmongHonduranHopiHoumaHungarianIcelanderIndian (Asian)IndonesianInupiatIranianIraqiIrishIroquoisIsraeliItalianJamaicanJapaneseJordanianKenyanKiowaKoreanLaotianLatvianLebaneseLiberianLithuanianLumbeeLuxembourgerMacedonianMalaysianMalteseMarshalleseMenomineeMexicanMexican American IndianMongolianMoroccanNative HawaiianNavajoNepaleseNew ZealanderNicaraguanNigerianNorthern EuropeanNorwegianOkinawanOsageOttawaPaiutePakistaniPalestinianPanamanianParaguayanPennsylvania GermanPeruvianPimaPolishPortuguesePotawatomiPuebloPuerto RicanPuget Sound SalishRomanianRussianSalvadoranSamoanScandinavianScotch-IrishScottishSeminoleSenegaleseSerbianShoshoneSierra LeoneanSiouxSlavicSloveneSomaliSouth AfricanSouth AmericanSouth American IndianSoviet UnionSpaniardSpanishSpanish AmericanSpanish American IndianSri LankanSubsaharan AfricanSudaneseSwedishSwissSyrianTaiwaneseThaiTlingit-HaidaTohono O'OdhamTonganTrinidadian and TobagonianTsimshianTurkishU.S. Virgin IslanderUgandanUkrainianUruguayanUteVenezuelanVietnameseWelshWest IndianYakamaYaquiYugoslavianYumanYup'ikZimbabwean
Immigration
NonimmigrantsImmigrantsAfghanistanAfricaAlbaniaArgentinaArmeniaAsiaAustraliaAustriaBahamasBangladeshBarbadosBelarusBelgiumBelizeBoliviaBosnia and HerzegovinaBrazilBulgariaBurma/MyanmarCabo VerdeCambodiaCameroonCanadaCaribbeanCentral AmericaChileChinaColombiaCongoCosta RicaCroatiaCubaCzechoslovakiaDenmarkDominicaDominican RepublicEastern AfricaEastern AsiaEastern EuropeEcuadorEgyptEl SalvadorEnglandEritreaEthiopiaEuropeFijiFranceGermanyGhanaGreeceGrenadaGuatemalaGuyanaHaitiHondurasHong KongHungaryIndiaIndonesiaIranIraqIrelandIsraelItalyJamaicaJapanJordanKazakhstanKenyaKoreaKuwaitLaosLatin AmericaLatviaLebanonLiberiaLithuaniaMalaysiaMexicoMicronesiaMiddle AfricaMoldovaMoroccoNepalNetherlandsNicaraguaNigeriaNorth AmericaNorth MacedoniaNorthern AfricaNorthern EuropeNorwayOceaniaPakistanPanamaPeruPhilippinesPolandPortugalRomaniaRussiaSaudi ArabiaScotlandSenegalSerbiaSierra LeoneSingaporeSomaliaSouth AfricaSouth AmericaSouth Central AsiaSouth Eastern AsiaSouthern EuropeSpainSri LankaSt. Vincent and the GrenadinesSudanSwedenSwitzerlandSyriaTaiwanThailandTrinidad and TobagoTurkeyUgandaUkraineUruguayUzbekistanVenezuelaVietnamWest IndiesWestern AfricaWestern AsiaWestern EuropeYemenZaireZimbabweAzores
Slovak
Race
Ancestry
AfghanAfricanAlaska NativeAlaskan AthabascanAlbanianAleutAlsatianAmericanApacheArabArapahoArgentineanArmenianAssyrian/Chaldean/SyriacAustralianAustrianBahamianBangladeshiBarbadianBasqueBelgianBelizeanBermudanBhutaneseBlackfeetBolivianBrazilianBritishBritish West IndianBulgarianBurmeseCajunCambodianCanadianCape VerdeanCarpatho RusynCelticCentral AmericanCentral American IndianCherokeeCheyenneChickasawChileanChineseChippewaChoctawColombianColvilleComancheCosta RicanCreeCreekCroatianCrowCubanCypriotCzechCzechoslovakianDanishDelawareDominicanDutchDutch West IndianEastern EuropeanEcuadorianEgyptianEnglishEstonianEthiopianEuropeanFijianFilipinoFinnishFrenchFrench American IndianFrench CanadianGermanGerman RussianGhanaianGreekGuamanian/ChamorroGuatemalanGuyaneseHaitianHmongHonduranHopiHoumaHungarianIcelanderIndian (Asian)IndonesianInupiatIranianIraqiIrishIroquoisIsraeliItalianJamaicanJapaneseJordanianKenyanKiowaKoreanLaotianLatvianLebaneseLiberianLithuanianLumbeeLuxembourgerMacedonianMalaysianMalteseMarshalleseMenomineeMexicanMexican American IndianMongolianMoroccanNative HawaiianNavajoNepaleseNew ZealanderNicaraguanNigerianNorthern EuropeanNorwegianOkinawanOsageOttawaPaiutePakistaniPalestinianPanamanianParaguayanPennsylvania GermanPeruvianPimaPolishPortuguesePotawatomiPuebloPuerto RicanPuget Sound SalishRomanianRussianSalvadoranSamoanScandinavianScotch-IrishScottishSeminoleSenegaleseSerbianShoshoneSierra LeoneanSiouxSlavicSlovakSloveneSomaliSouth AfricanSouth AmericanSouth American IndianSoviet UnionSpaniardSpanishSpanish AmericanSpanish American IndianSri LankanSubsaharan AfricanSudaneseSwedishSwissSyrianTaiwaneseThaiTlingit-HaidaTohono O'OdhamTonganTrinidadian and TobagonianTsimshianTurkishU.S. Virgin IslanderUgandanUkrainianUruguayanUteVenezuelanVietnameseWelshWest IndianYakamaYaquiYugoslavianYumanYup'ikZimbabwean
Immigration
NonimmigrantsImmigrantsAfricaAlbaniaArgentinaArmeniaAsiaAustraliaAustriaBahamasBangladeshBarbadosBelarusBelgiumBelizeBoliviaBosnia and HerzegovinaBrazilBulgariaBurma/MyanmarCabo VerdeCambodiaCameroonCanadaCaribbeanCentral AmericaChileChinaColombiaCongoCosta RicaCroatiaCubaCzechoslovakiaDenmarkDominicaDominican RepublicEastern AfricaEastern AsiaEastern EuropeEcuadorEgyptEl SalvadorEnglandEritreaEthiopiaEuropeFijiFranceGermanyGhanaGreeceGrenadaGuatemalaGuyanaHaitiHondurasHong KongHungaryIndiaIndonesiaIranIraqIrelandIsraelItalyJamaicaJapanJordanKazakhstanKenyaKoreaKuwaitLaosLatin AmericaLatviaLebanonLiberiaLithuaniaMalaysiaMexicoMicronesiaMiddle AfricaMoldovaMoroccoNepalNetherlandsNicaraguaNigeriaNorth AmericaNorth MacedoniaNorthern AfricaNorthern EuropeNorwayOceaniaPakistanPanamaPeruPhilippinesPolandPortugalRomaniaRussiaSaudi ArabiaScotlandSenegalSerbiaSierra LeoneSingaporeSomaliaSouth AfricaSouth AmericaSouth Central AsiaSouth Eastern AsiaSouthern EuropeSpainSri LankaSt. Vincent and the GrenadinesSudanSwedenSwitzerlandSyriaTaiwanThailandTrinidad and TobagoTurkeyUgandaUkraineUruguayUzbekistanVenezuelaVietnamWest IndiesWestern AfricaWestern AsiaWestern EuropeYemenZaireZimbabweAzores
Kindergarten
Income
Poverty
Unemployment
Labor Participation
Family Structure
Vehicle Availability
Education Level
Disability

Kindergarten Comparison

Immigrants from Afghanistan

Slovaks

Tragic
Exceptional
97.3%
KINDERGARTEN
0.0/ 100
METRIC RATING
289th/ 347
METRIC RANK
98.7%
KINDERGARTEN
100.0/ 100
METRIC RATING
10th/ 347
METRIC RANK

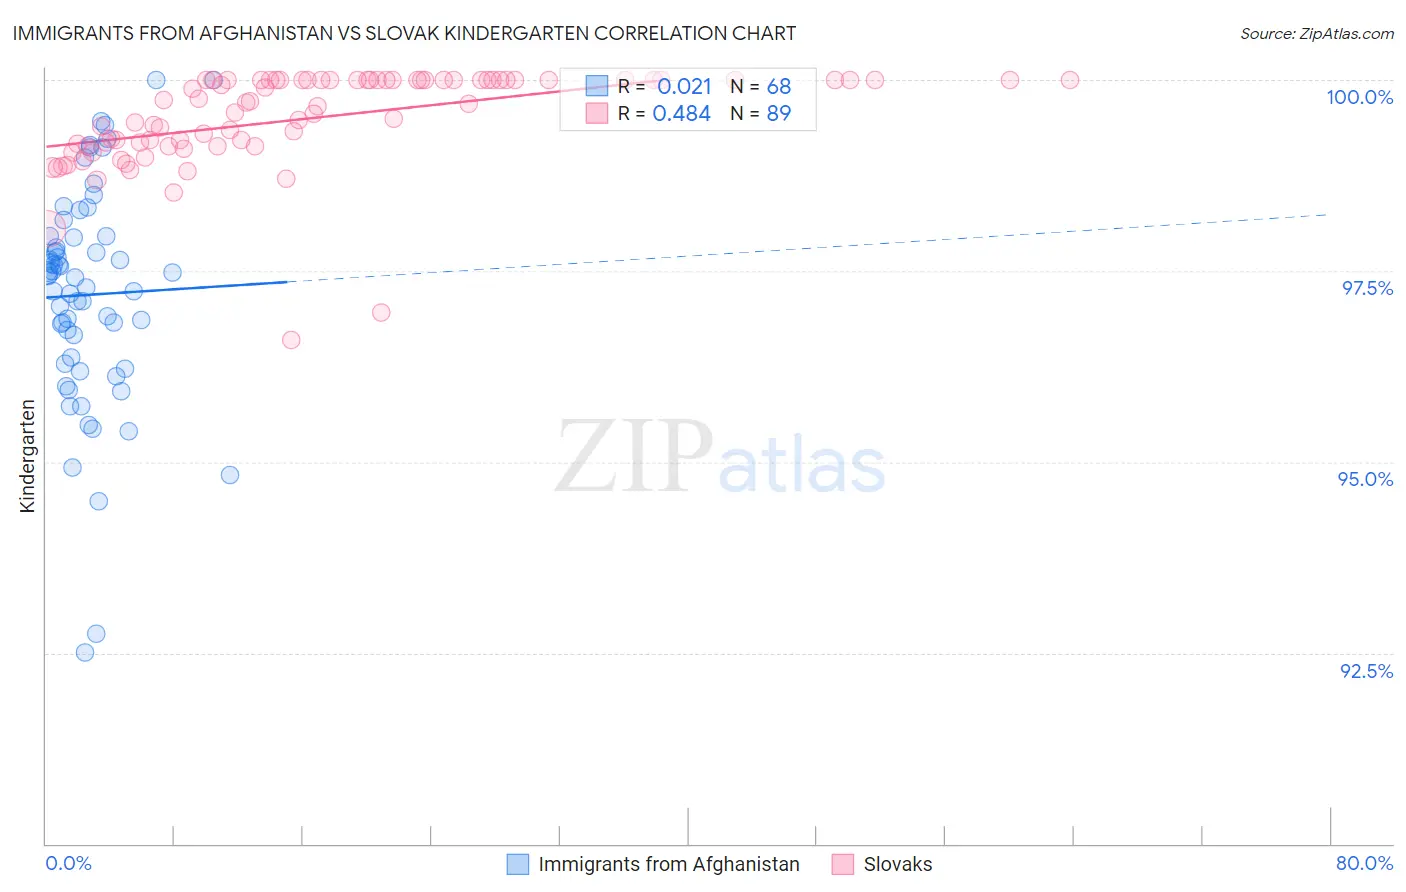
Immigrants from Afghanistan vs Slovak Kindergarten Correlation Chart

The statistical analysis conducted on geographies consisting of 147,629,924 people shows no correlation between the proportion of Immigrants from Afghanistan and percentage of population with at least kindergarten education in the United States with a correlation coefficient (R) of 0.021 and weighted average of 97.3%. Similarly, the statistical analysis conducted on geographies consisting of 397,891,514 people shows a moderate positive correlation between the proportion of Slovaks and percentage of population with at least kindergarten education in the United States with a correlation coefficient (R) of 0.484 and weighted average of 98.7%, a difference of 1.5%.
Immigrants from Afghanistan vs Slovak Kindergarten

Kindergarten Correlation Summary

MeasurementImmigrants from AfghanistanSlovak
Minimum92.5%96.6%
Maximum100.0%100.0%
Range7.5%3.4%
Mean97.2%99.5%
Median97.4%99.7%
Interquartile 25% (IQ1)96.3%99.1%
Interquartile 75% (IQ3)97.9%100.0%
Interquartile Range (IQR)1.6%0.86%
Standard Deviation (Sample)1.5%0.63%
Standard Deviation (Population)1.4%0.63%

Similar Demographics by Kindergarten

Demographics Similar to Immigrants from Afghanistan by Kindergarten

In terms of kindergarten, the demographic groups most similar to Immigrants from Afghanistan are Immigrants from St. Vincent and the Grenadines (97.3%, a difference of 0.010%), Immigrants from Thailand (97.3%, a difference of 0.020%), Immigrants from Barbados (97.3%, a difference of 0.030%), Immigrants from Hong Kong (97.3%, a difference of 0.030%), and Houma (97.3%, a difference of 0.030%).
DemographicsRating | RankKindergarten
Afghans
0.0
/100
|
#282
Tragic
97.4%
Immigrants | West Indies
0.0
/100
|
#283
Tragic
97.3%
Immigrants | Trinidad and Tobago
0.0
/100
|
#284
Tragic
97.3%
Immigrants | Portugal
0.0
/100
|
#285
Tragic
97.3%
Immigrants | Barbados
0.0
/100
|
#286
Tragic
97.3%
Immigrants | Hong Kong
0.0
/100
|
#287
Tragic
97.3%
Immigrants | Thailand
0.0
/100
|
#288
Tragic
97.3%
Immigrants | Afghanistan
0.0
/100
|
#289
Tragic
97.3%
Immigrants | St. Vincent and the Grenadines
0.0
/100
|
#290
Tragic
97.3%
Houma
0.0
/100
|
#291
Tragic
97.3%
British West Indians
0.0
/100
|
#292
Tragic
97.3%
Malaysians
0.0
/100
|
#293
Tragic
97.2%
Immigrants | Immigrants
0.0
/100
|
#294
Tragic
97.2%
Immigrants | Grenada
0.0
/100
|
#295
Tragic
97.2%
Immigrants | Eritrea
0.0
/100
|
#296
Tragic
97.2%

Demographics Similar to Slovaks by Kindergarten

In terms of kindergarten, the demographic groups most similar to Slovaks are Tlingit-Haida (98.7%, a difference of 0.0%), German (98.7%, a difference of 0.0%), Norwegian (98.7%, a difference of 0.020%), Slovene (98.7%, a difference of 0.030%), and Alaska Native (98.7%, a difference of 0.040%).
DemographicsRating | RankKindergarten
Inupiat
100.0
/100
|
#3
Exceptional
98.9%
Welsh
100.0
/100
|
#4
Exceptional
98.9%
Tsimshian
100.0
/100
|
#5
Exceptional
98.8%
Alaskan Athabascans
100.0
/100
|
#6
Exceptional
98.8%
Alaska Natives
100.0
/100
|
#7
Exceptional
98.7%
Norwegians
100.0
/100
|
#8
Exceptional
98.7%
Tlingit-Haida
100.0
/100
|
#9
Exceptional
98.7%
Slovaks
100.0
/100
|
#10
Exceptional
98.7%
Germans
100.0
/100
|
#11
Exceptional
98.7%
Slovenes
100.0
/100
|
#12
Exceptional
98.7%
Carpatho Rusyns
100.0
/100
|
#13
Exceptional
98.7%
English
100.0
/100
|
#14
Exceptional
98.7%
Swedes
100.0
/100
|
#15
Exceptional
98.7%
Aleuts
100.0
/100
|
#16
Exceptional
98.6%
Scottish
100.0
/100
|
#17
Exceptional
98.6%