Celtic vs Portuguese In Labor Force | Age 30-34
COMPARE
Celtic
Portuguese
In Labor Force | Age 30-34
In Labor Force | Age 30-34 Comparison
Celtics
Portuguese
84.1%
IN LABOR FORCE | AGE 30-34
1.4/ 100
METRIC RATING
237th/ 347
METRIC RANK
84.0%
IN LABOR FORCE | AGE 30-34
0.8/ 100
METRIC RATING
248th/ 347
METRIC RANK
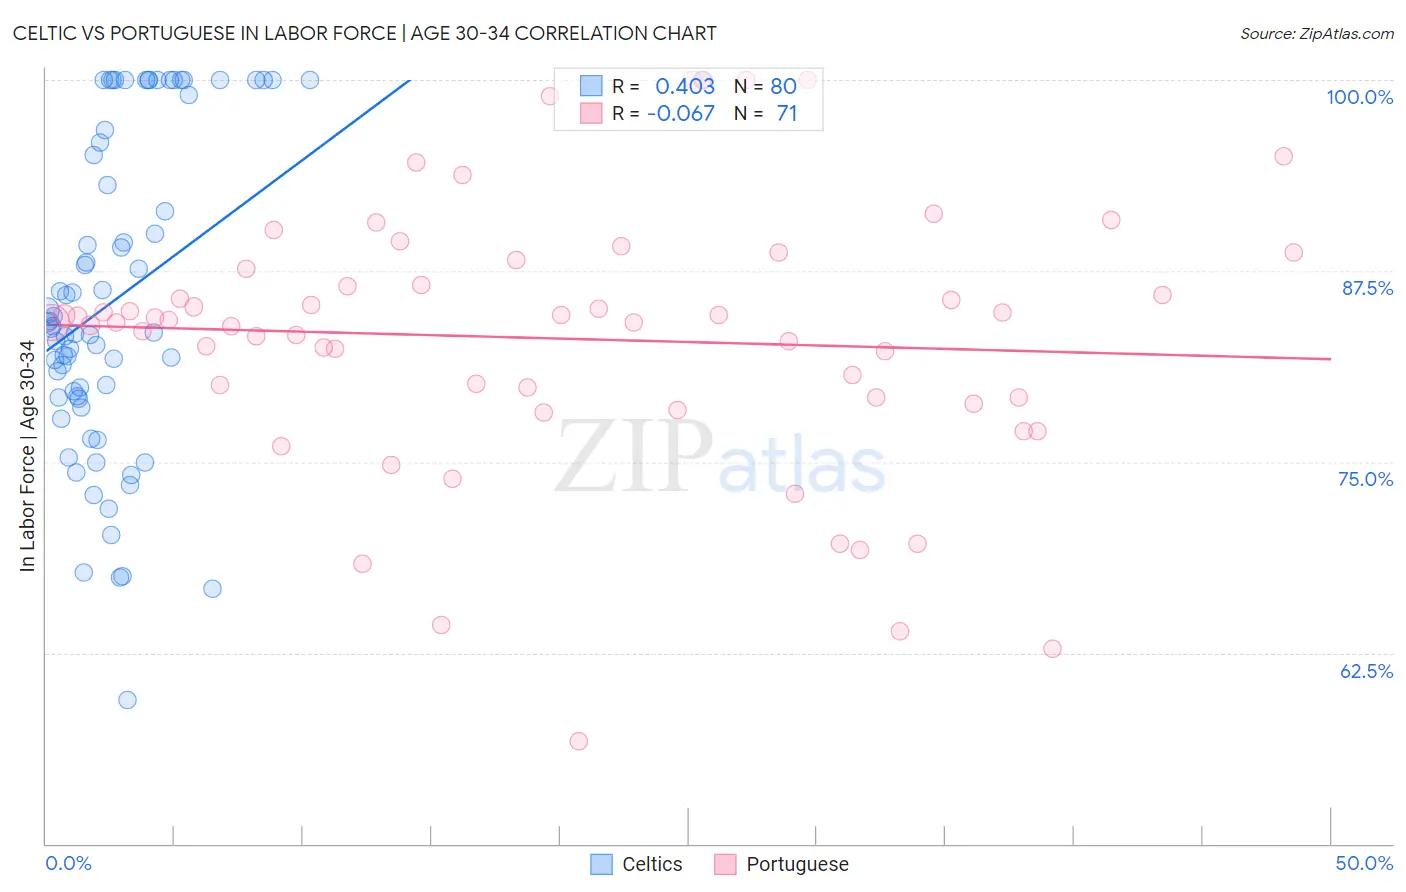
Celtic vs Portuguese In Labor Force | Age 30-34 Correlation Chart
The statistical analysis conducted on geographies consisting of 168,853,097 people shows a moderate positive correlation between the proportion of Celtics and labor force participation rate among population between the ages 30 and 34 in the United States with a correlation coefficient (R) of 0.403 and weighted average of 84.1%. Similarly, the statistical analysis conducted on geographies consisting of 449,906,735 people shows a slight negative correlation between the proportion of Portuguese and labor force participation rate among population between the ages 30 and 34 in the United States with a correlation coefficient (R) of -0.067 and weighted average of 84.0%, a difference of 0.11%.
In Labor Force | Age 30-34 Correlation Summary
| Measurement | Celtic | Portuguese |
| Minimum | 59.4% | 56.7% |
| Maximum | 100.0% | 100.0% |
| Range | 40.6% | 43.3% |
| Mean | 85.9% | 83.1% |
| Median | 84.0% | 84.1% |
| Interquartile 25% (IQ1) | 79.3% | 79.2% |
| Interquartile 75% (IQ3) | 97.8% | 87.7% |
| Interquartile Range (IQR) | 18.6% | 8.5% |
| Standard Deviation (Sample) | 10.4% | 8.8% |
| Standard Deviation (Population) | 10.4% | 8.7% |
Demographics Similar to Celtics and Portuguese by In Labor Force | Age 30-34
In terms of in labor force | age 30-34, the demographic groups most similar to Celtics are Immigrants from Barbados (84.0%, a difference of 0.0%), U.S. Virgin Islander (84.1%, a difference of 0.010%), English (84.0%, a difference of 0.010%), Venezuelan (84.0%, a difference of 0.010%), and French American Indian (84.1%, a difference of 0.030%). Similarly, the demographic groups most similar to Portuguese are Immigrants from Dominica (84.0%, a difference of 0.0%), British West Indian (84.0%, a difference of 0.010%), Immigrants from Iraq (83.9%, a difference of 0.020%), Basque (84.0%, a difference of 0.030%), and Immigrants from Venezuela (84.0%, a difference of 0.030%).
| Demographics | Rating | Rank | In Labor Force | Age 30-34 |
| Immigrants | Immigrants | 2.0 /100 | #232 | Tragic 84.1% |
| West Indians | 1.9 /100 | #233 | Tragic 84.1% |
| Haitians | 1.8 /100 | #234 | Tragic 84.1% |
| French American Indians | 1.7 /100 | #235 | Tragic 84.1% |
| U.S. Virgin Islanders | 1.5 /100 | #236 | Tragic 84.1% |
| Celtics | 1.4 /100 | #237 | Tragic 84.1% |
| Immigrants | Barbados | 1.4 /100 | #238 | Tragic 84.0% |
| English | 1.4 /100 | #239 | Tragic 84.0% |
| Venezuelans | 1.3 /100 | #240 | Tragic 84.0% |
| Immigrants | Portugal | 1.2 /100 | #241 | Tragic 84.0% |
| Immigrants | Oceania | 1.1 /100 | #242 | Tragic 84.0% |
| Immigrants | Caribbean | 1.1 /100 | #243 | Tragic 84.0% |
| Basques | 0.9 /100 | #244 | Tragic 84.0% |
| Immigrants | Venezuela | 0.9 /100 | #245 | Tragic 84.0% |
| Central Americans | 0.9 /100 | #246 | Tragic 84.0% |
| British West Indians | 0.8 /100 | #247 | Tragic 84.0% |
| Portuguese | 0.8 /100 | #248 | Tragic 84.0% |
| Immigrants | Dominica | 0.7 /100 | #249 | Tragic 84.0% |
| Immigrants | Iraq | 0.7 /100 | #250 | Tragic 83.9% |
| Nicaraguans | 0.6 /100 | #251 | Tragic 83.9% |
| Bahamians | 0.6 /100 | #252 | Tragic 83.9% |