Serbian vs Portuguese In Labor Force | Age 30-34
COMPARE
Serbian
Portuguese
In Labor Force | Age 30-34
In Labor Force | Age 30-34 Comparison
Serbians
Portuguese
85.8%
IN LABOR FORCE | AGE 30-34
99.9/ 100
METRIC RATING
35th/ 347
METRIC RANK
84.0%
IN LABOR FORCE | AGE 30-34
0.8/ 100
METRIC RATING
248th/ 347
METRIC RANK
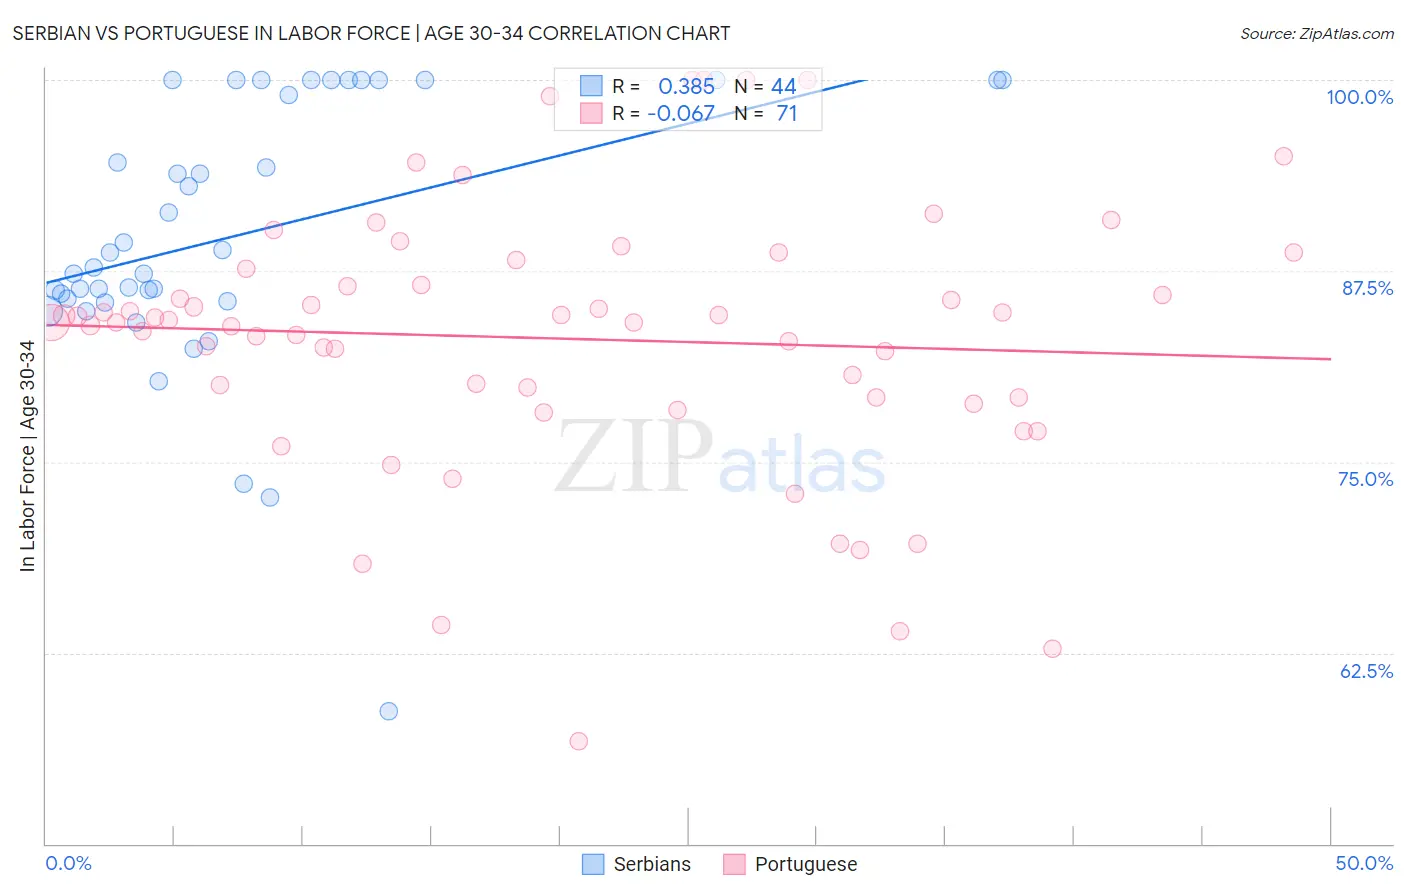
Serbian vs Portuguese In Labor Force | Age 30-34 Correlation Chart
The statistical analysis conducted on geographies consisting of 267,513,994 people shows a mild positive correlation between the proportion of Serbians and labor force participation rate among population between the ages 30 and 34 in the United States with a correlation coefficient (R) of 0.385 and weighted average of 85.8%. Similarly, the statistical analysis conducted on geographies consisting of 449,906,735 people shows a slight negative correlation between the proportion of Portuguese and labor force participation rate among population between the ages 30 and 34 in the United States with a correlation coefficient (R) of -0.067 and weighted average of 84.0%, a difference of 2.1%.
In Labor Force | Age 30-34 Correlation Summary
| Measurement | Serbian | Portuguese |
| Minimum | 58.7% | 56.7% |
| Maximum | 100.0% | 100.0% |
| Range | 41.3% | 43.3% |
| Mean | 89.9% | 83.1% |
| Median | 88.2% | 84.1% |
| Interquartile 25% (IQ1) | 85.6% | 79.2% |
| Interquartile 75% (IQ3) | 100.0% | 87.7% |
| Interquartile Range (IQR) | 14.4% | 8.5% |
| Standard Deviation (Sample) | 8.9% | 8.8% |
| Standard Deviation (Population) | 8.8% | 8.7% |
Similar Demographics by In Labor Force | Age 30-34
Demographics Similar to Serbians by In Labor Force | Age 30-34
In terms of in labor force | age 30-34, the demographic groups most similar to Serbians are Ugandan (85.8%, a difference of 0.0%), Albanian (85.7%, a difference of 0.0%), Immigrants from Bosnia and Herzegovina (85.8%, a difference of 0.010%), Norwegian (85.7%, a difference of 0.010%), and Immigrants from Greece (85.7%, a difference of 0.020%).
| Demographics | Rating | Rank | In Labor Force | Age 30-34 |
| Immigrants | Latvia | 100.0 /100 | #28 | Exceptional 85.9% |
| Tsimshian | 100.0 /100 | #29 | Exceptional 85.8% |
| Immigrants | Hong Kong | 100.0 /100 | #30 | Exceptional 85.8% |
| Paraguayans | 99.9 /100 | #31 | Exceptional 85.8% |
| Cypriots | 99.9 /100 | #32 | Exceptional 85.8% |
| Immigrants | Bosnia and Herzegovina | 99.9 /100 | #33 | Exceptional 85.8% |
| Ugandans | 99.9 /100 | #34 | Exceptional 85.8% |
| Serbians | 99.9 /100 | #35 | Exceptional 85.8% |
| Albanians | 99.9 /100 | #36 | Exceptional 85.7% |
| Norwegians | 99.9 /100 | #37 | Exceptional 85.7% |
| Immigrants | Greece | 99.9 /100 | #38 | Exceptional 85.7% |
| Eastern Europeans | 99.9 /100 | #39 | Exceptional 85.7% |
| Turks | 99.9 /100 | #40 | Exceptional 85.7% |
| Immigrants | Italy | 99.9 /100 | #41 | Exceptional 85.7% |
| Zimbabweans | 99.8 /100 | #42 | Exceptional 85.6% |
Demographics Similar to Portuguese by In Labor Force | Age 30-34
In terms of in labor force | age 30-34, the demographic groups most similar to Portuguese are Immigrants from Dominica (84.0%, a difference of 0.0%), British West Indian (84.0%, a difference of 0.010%), Immigrants from Iraq (83.9%, a difference of 0.020%), Basque (84.0%, a difference of 0.030%), and Immigrants from Venezuela (84.0%, a difference of 0.030%).
| Demographics | Rating | Rank | In Labor Force | Age 30-34 |
| Immigrants | Portugal | 1.2 /100 | #241 | Tragic 84.0% |
| Immigrants | Oceania | 1.1 /100 | #242 | Tragic 84.0% |
| Immigrants | Caribbean | 1.1 /100 | #243 | Tragic 84.0% |
| Basques | 0.9 /100 | #244 | Tragic 84.0% |
| Immigrants | Venezuela | 0.9 /100 | #245 | Tragic 84.0% |
| Central Americans | 0.9 /100 | #246 | Tragic 84.0% |
| British West Indians | 0.8 /100 | #247 | Tragic 84.0% |
| Portuguese | 0.8 /100 | #248 | Tragic 84.0% |
| Immigrants | Dominica | 0.7 /100 | #249 | Tragic 84.0% |
| Immigrants | Iraq | 0.7 /100 | #250 | Tragic 83.9% |
| Nicaraguans | 0.6 /100 | #251 | Tragic 83.9% |
| Bahamians | 0.6 /100 | #252 | Tragic 83.9% |
| Immigrants | Nicaragua | 0.6 /100 | #253 | Tragic 83.9% |
| Immigrants | St. Vincent and the Grenadines | 0.5 /100 | #254 | Tragic 83.9% |
| Whites/Caucasians | 0.5 /100 | #255 | Tragic 83.9% |