Italian vs Portuguese In Labor Force | Age 30-34
COMPARE
Italian
Portuguese
In Labor Force | Age 30-34
In Labor Force | Age 30-34 Comparison
Italians
Portuguese
85.4%
IN LABOR FORCE | AGE 30-34
99.4/ 100
METRIC RATING
64th/ 347
METRIC RANK
84.0%
IN LABOR FORCE | AGE 30-34
0.8/ 100
METRIC RATING
248th/ 347
METRIC RANK
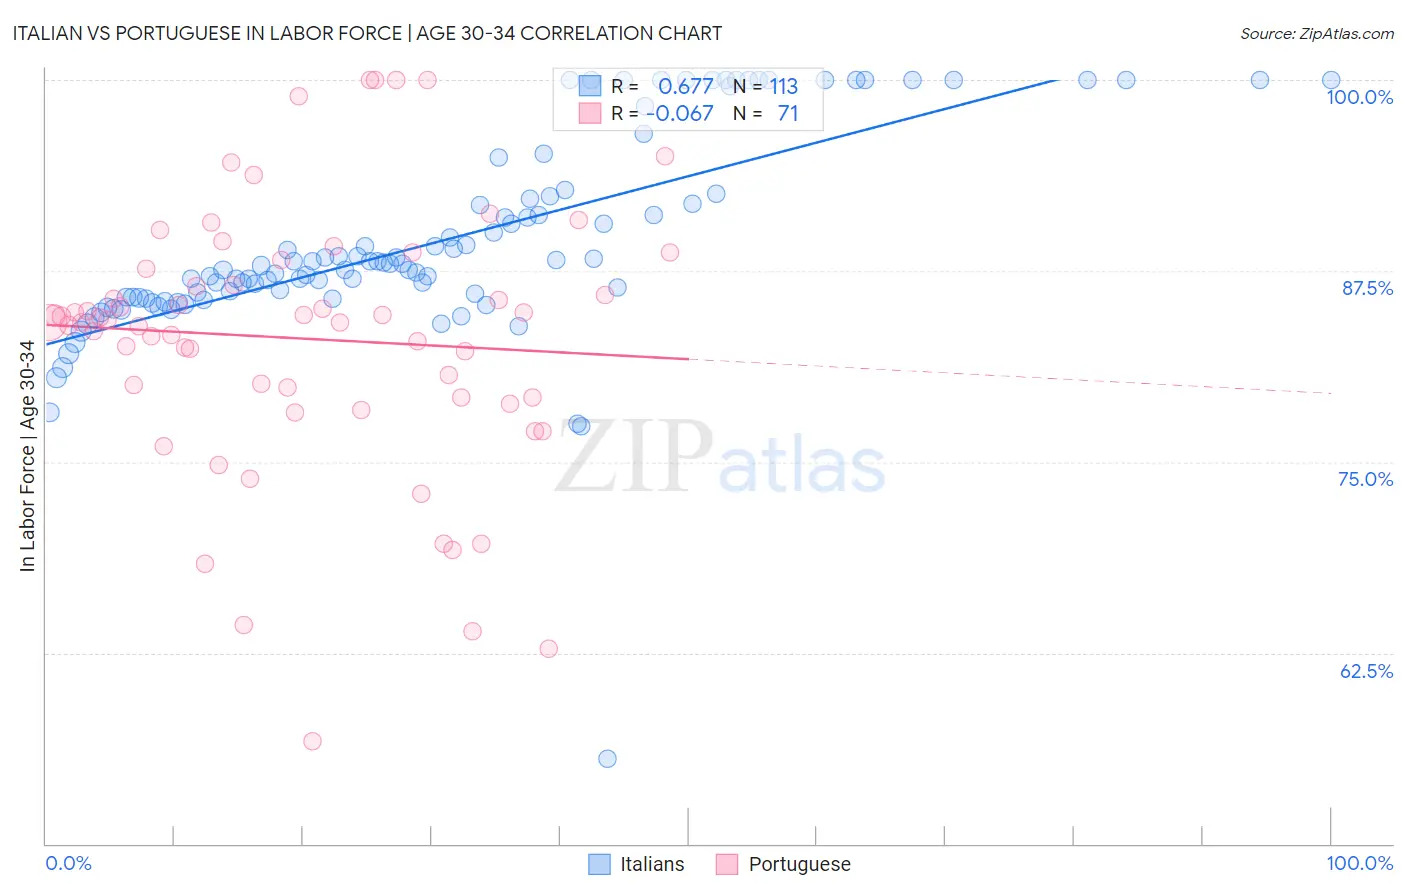
Italian vs Portuguese In Labor Force | Age 30-34 Correlation Chart
The statistical analysis conducted on geographies consisting of 573,629,236 people shows a significant positive correlation between the proportion of Italians and labor force participation rate among population between the ages 30 and 34 in the United States with a correlation coefficient (R) of 0.677 and weighted average of 85.4%. Similarly, the statistical analysis conducted on geographies consisting of 449,906,735 people shows a slight negative correlation between the proportion of Portuguese and labor force participation rate among population between the ages 30 and 34 in the United States with a correlation coefficient (R) of -0.067 and weighted average of 84.0%, a difference of 1.8%.
In Labor Force | Age 30-34 Correlation Summary
| Measurement | Italian | Portuguese |
| Minimum | 55.6% | 56.7% |
| Maximum | 100.0% | 100.0% |
| Range | 44.4% | 43.3% |
| Mean | 89.4% | 83.1% |
| Median | 87.9% | 84.1% |
| Interquartile 25% (IQ1) | 85.7% | 79.2% |
| Interquartile 75% (IQ3) | 92.3% | 87.7% |
| Interquartile Range (IQR) | 6.6% | 8.5% |
| Standard Deviation (Sample) | 6.7% | 8.8% |
| Standard Deviation (Population) | 6.7% | 8.7% |
Similar Demographics by In Labor Force | Age 30-34
Demographics Similar to Italians by In Labor Force | Age 30-34
In terms of in labor force | age 30-34, the demographic groups most similar to Italians are Senegalese (85.4%, a difference of 0.0%), Soviet Union (85.5%, a difference of 0.010%), Macedonian (85.5%, a difference of 0.010%), Ghanaian (85.4%, a difference of 0.010%), and Immigrants from France (85.5%, a difference of 0.020%).
| Demographics | Rating | Rank | In Labor Force | Age 30-34 |
| Russians | 99.6 /100 | #57 | Exceptional 85.5% |
| Poles | 99.6 /100 | #58 | Exceptional 85.5% |
| Immigrants | Poland | 99.5 /100 | #59 | Exceptional 85.5% |
| Immigrants | France | 99.5 /100 | #60 | Exceptional 85.5% |
| Immigrants | Brazil | 99.5 /100 | #61 | Exceptional 85.5% |
| Soviet Union | 99.4 /100 | #62 | Exceptional 85.5% |
| Macedonians | 99.4 /100 | #63 | Exceptional 85.5% |
| Italians | 99.4 /100 | #64 | Exceptional 85.4% |
| Senegalese | 99.4 /100 | #65 | Exceptional 85.4% |
| Ghanaians | 99.4 /100 | #66 | Exceptional 85.4% |
| Kenyans | 99.3 /100 | #67 | Exceptional 85.4% |
| Immigrants | Eastern Europe | 99.3 /100 | #68 | Exceptional 85.4% |
| Immigrants | Iran | 99.2 /100 | #69 | Exceptional 85.4% |
| Brazilians | 99.1 /100 | #70 | Exceptional 85.4% |
| Immigrants | Japan | 99.1 /100 | #71 | Exceptional 85.4% |
Demographics Similar to Portuguese by In Labor Force | Age 30-34
In terms of in labor force | age 30-34, the demographic groups most similar to Portuguese are Immigrants from Dominica (84.0%, a difference of 0.0%), British West Indian (84.0%, a difference of 0.010%), Immigrants from Iraq (83.9%, a difference of 0.020%), Basque (84.0%, a difference of 0.030%), and Immigrants from Venezuela (84.0%, a difference of 0.030%).
| Demographics | Rating | Rank | In Labor Force | Age 30-34 |
| Immigrants | Portugal | 1.2 /100 | #241 | Tragic 84.0% |
| Immigrants | Oceania | 1.1 /100 | #242 | Tragic 84.0% |
| Immigrants | Caribbean | 1.1 /100 | #243 | Tragic 84.0% |
| Basques | 0.9 /100 | #244 | Tragic 84.0% |
| Immigrants | Venezuela | 0.9 /100 | #245 | Tragic 84.0% |
| Central Americans | 0.9 /100 | #246 | Tragic 84.0% |
| British West Indians | 0.8 /100 | #247 | Tragic 84.0% |
| Portuguese | 0.8 /100 | #248 | Tragic 84.0% |
| Immigrants | Dominica | 0.7 /100 | #249 | Tragic 84.0% |
| Immigrants | Iraq | 0.7 /100 | #250 | Tragic 83.9% |
| Nicaraguans | 0.6 /100 | #251 | Tragic 83.9% |
| Bahamians | 0.6 /100 | #252 | Tragic 83.9% |
| Immigrants | Nicaragua | 0.6 /100 | #253 | Tragic 83.9% |
| Immigrants | St. Vincent and the Grenadines | 0.5 /100 | #254 | Tragic 83.9% |
| Whites/Caucasians | 0.5 /100 | #255 | Tragic 83.9% |