Immigrants from Philippines vs Immigrants from Uzbekistan In Labor Force | Age 35-44
COMPARE
Immigrants from Philippines
Immigrants from Uzbekistan
In Labor Force | Age 35-44
In Labor Force | Age 35-44 Comparison
Immigrants from Philippines
Immigrants from Uzbekistan
84.2%
IN LABOR FORCE | AGE 35-44
27.9/ 100
METRIC RATING
191st/ 347
METRIC RANK
84.2%
IN LABOR FORCE | AGE 35-44
22.8/ 100
METRIC RATING
202nd/ 347
METRIC RANK
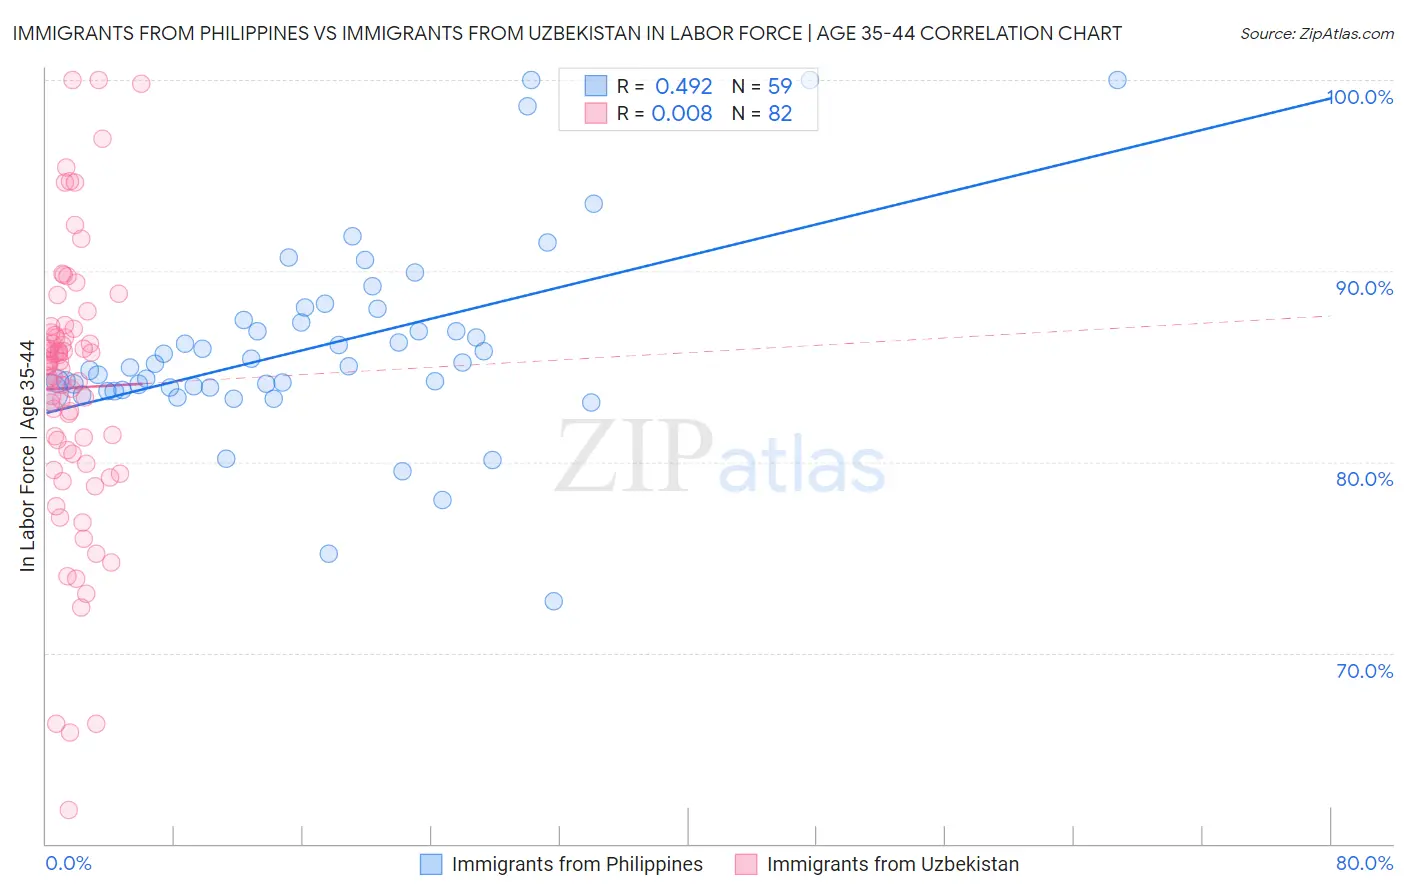
Immigrants from Philippines vs Immigrants from Uzbekistan In Labor Force | Age 35-44 Correlation Chart
The statistical analysis conducted on geographies consisting of 471,128,503 people shows a moderate positive correlation between the proportion of Immigrants from Philippines and labor force participation rate among population between the ages 35 and 44 in the United States with a correlation coefficient (R) of 0.492 and weighted average of 84.2%. Similarly, the statistical analysis conducted on geographies consisting of 118,733,606 people shows no correlation between the proportion of Immigrants from Uzbekistan and labor force participation rate among population between the ages 35 and 44 in the United States with a correlation coefficient (R) of 0.008 and weighted average of 84.2%, a difference of 0.040%.
In Labor Force | Age 35-44 Correlation Summary
| Measurement | Immigrants from Philippines | Immigrants from Uzbekistan |
| Minimum | 72.7% | 61.8% |
| Maximum | 100.0% | 100.0% |
| Range | 27.3% | 38.2% |
| Mean | 86.0% | 83.9% |
| Median | 85.0% | 85.0% |
| Interquartile 25% (IQ1) | 83.8% | 80.4% |
| Interquartile 75% (IQ3) | 87.4% | 86.8% |
| Interquartile Range (IQR) | 3.6% | 6.4% |
| Standard Deviation (Sample) | 5.1% | 7.3% |
| Standard Deviation (Population) | 5.1% | 7.2% |
Demographics Similar to Immigrants from Philippines and Immigrants from Uzbekistan by In Labor Force | Age 35-44
In terms of in labor force | age 35-44, the demographic groups most similar to Immigrants from Philippines are Immigrants from Vietnam (84.2%, a difference of 0.0%), Hungarian (84.2%, a difference of 0.010%), Immigrants from Indonesia (84.2%, a difference of 0.020%), Immigrants from Caribbean (84.2%, a difference of 0.020%), and Immigrants from England (84.2%, a difference of 0.020%). Similarly, the demographic groups most similar to Immigrants from Uzbekistan are Syrian (84.2%, a difference of 0.0%), Moroccan (84.2%, a difference of 0.0%), British (84.2%, a difference of 0.0%), Immigrants from South Eastern Asia (84.2%, a difference of 0.0%), and Ecuadorian (84.2%, a difference of 0.010%).
| Demographics | Rating | Rank | In Labor Force | Age 35-44 |
| Australians | 35.1 /100 | #186 | Fair 84.3% |
| Dutch | 34.8 /100 | #187 | Fair 84.3% |
| South Africans | 34.1 /100 | #188 | Fair 84.3% |
| Immigrants | Denmark | 33.7 /100 | #189 | Fair 84.3% |
| Portuguese | 31.9 /100 | #190 | Fair 84.3% |
| Immigrants | Philippines | 27.9 /100 | #191 | Fair 84.2% |
| Immigrants | Vietnam | 27.4 /100 | #192 | Fair 84.2% |
| Hungarians | 26.8 /100 | #193 | Fair 84.2% |
| Immigrants | Indonesia | 25.7 /100 | #194 | Fair 84.2% |
| Immigrants | Caribbean | 25.7 /100 | #195 | Fair 84.2% |
| Immigrants | England | 25.0 /100 | #196 | Fair 84.2% |
| Immigrants | Western Europe | 24.7 /100 | #197 | Fair 84.2% |
| Ecuadorians | 24.0 /100 | #198 | Fair 84.2% |
| Syrians | 23.2 /100 | #199 | Fair 84.2% |
| Moroccans | 23.2 /100 | #200 | Fair 84.2% |
| British | 23.0 /100 | #201 | Fair 84.2% |
| Immigrants | Uzbekistan | 22.8 /100 | #202 | Fair 84.2% |
| Immigrants | South Eastern Asia | 22.4 /100 | #203 | Fair 84.2% |
| Canadians | 19.9 /100 | #204 | Poor 84.2% |
| Immigrants | Canada | 19.6 /100 | #205 | Poor 84.2% |
| Immigrants | Costa Rica | 19.5 /100 | #206 | Poor 84.2% |