Jordanian vs Immigrants from Uzbekistan In Labor Force | Age 35-44
COMPARE
Jordanian
Immigrants from Uzbekistan
In Labor Force | Age 35-44
In Labor Force | Age 35-44 Comparison
Jordanians
Immigrants from Uzbekistan
84.4%
IN LABOR FORCE | AGE 35-44
51.7/ 100
METRIC RATING
171st/ 347
METRIC RANK
84.2%
IN LABOR FORCE | AGE 35-44
22.8/ 100
METRIC RATING
202nd/ 347
METRIC RANK
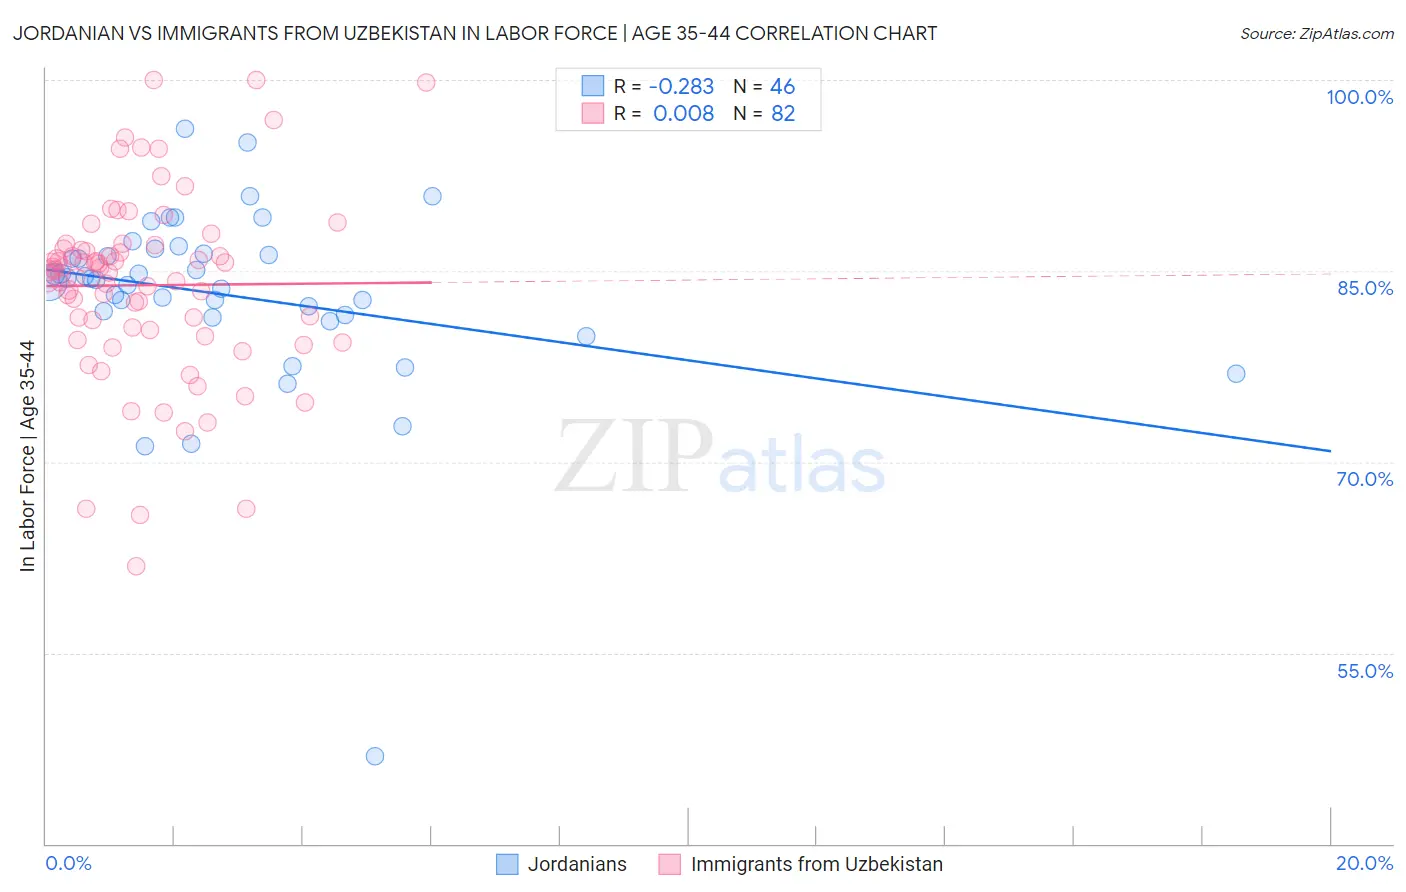
Jordanian vs Immigrants from Uzbekistan In Labor Force | Age 35-44 Correlation Chart
The statistical analysis conducted on geographies consisting of 166,398,743 people shows a weak negative correlation between the proportion of Jordanians and labor force participation rate among population between the ages 35 and 44 in the United States with a correlation coefficient (R) of -0.283 and weighted average of 84.4%. Similarly, the statistical analysis conducted on geographies consisting of 118,733,606 people shows no correlation between the proportion of Immigrants from Uzbekistan and labor force participation rate among population between the ages 35 and 44 in the United States with a correlation coefficient (R) of 0.008 and weighted average of 84.2%, a difference of 0.21%.
In Labor Force | Age 35-44 Correlation Summary
| Measurement | Jordanian | Immigrants from Uzbekistan |
| Minimum | 46.9% | 61.8% |
| Maximum | 96.2% | 100.0% |
| Range | 49.3% | 38.2% |
| Mean | 83.1% | 83.9% |
| Median | 84.3% | 85.0% |
| Interquartile 25% (IQ1) | 81.5% | 80.4% |
| Interquartile 75% (IQ3) | 86.3% | 86.8% |
| Interquartile Range (IQR) | 4.8% | 6.4% |
| Standard Deviation (Sample) | 7.5% | 7.3% |
| Standard Deviation (Population) | 7.5% | 7.2% |
Similar Demographics by In Labor Force | Age 35-44
Demographics Similar to Jordanians by In Labor Force | Age 35-44
In terms of in labor force | age 35-44, the demographic groups most similar to Jordanians are Immigrants from Jordan (84.4%, a difference of 0.0%), Scandinavian (84.4%, a difference of 0.0%), Irish (84.4%, a difference of 0.010%), Immigrants from Afghanistan (84.4%, a difference of 0.010%), and Immigrants from Trinidad and Tobago (84.4%, a difference of 0.010%).
| Demographics | Rating | Rank | In Labor Force | Age 35-44 |
| Nigerians | 58.9 /100 | #164 | Average 84.4% |
| Venezuelans | 58.1 /100 | #165 | Average 84.4% |
| Alsatians | 55.2 /100 | #166 | Average 84.4% |
| Immigrants | Portugal | 55.2 /100 | #167 | Average 84.4% |
| Irish | 53.1 /100 | #168 | Average 84.4% |
| Immigrants | Afghanistan | 52.7 /100 | #169 | Average 84.4% |
| Immigrants | Jordan | 52.5 /100 | #170 | Average 84.4% |
| Jordanians | 51.7 /100 | #171 | Average 84.4% |
| Scandinavians | 51.2 /100 | #172 | Average 84.4% |
| Immigrants | Trinidad and Tobago | 50.7 /100 | #173 | Average 84.4% |
| Immigrants | Iran | 50.0 /100 | #174 | Average 84.4% |
| Pakistanis | 48.2 /100 | #175 | Average 84.4% |
| Sri Lankans | 47.3 /100 | #176 | Average 84.4% |
| French Canadians | 44.3 /100 | #177 | Average 84.3% |
| Northern Europeans | 44.1 /100 | #178 | Average 84.3% |
Demographics Similar to Immigrants from Uzbekistan by In Labor Force | Age 35-44
In terms of in labor force | age 35-44, the demographic groups most similar to Immigrants from Uzbekistan are Syrian (84.2%, a difference of 0.0%), Moroccan (84.2%, a difference of 0.0%), British (84.2%, a difference of 0.0%), Immigrants from South Eastern Asia (84.2%, a difference of 0.0%), and Ecuadorian (84.2%, a difference of 0.010%).
| Demographics | Rating | Rank | In Labor Force | Age 35-44 |
| Immigrants | Caribbean | 25.7 /100 | #195 | Fair 84.2% |
| Immigrants | England | 25.0 /100 | #196 | Fair 84.2% |
| Immigrants | Western Europe | 24.7 /100 | #197 | Fair 84.2% |
| Ecuadorians | 24.0 /100 | #198 | Fair 84.2% |
| Syrians | 23.2 /100 | #199 | Fair 84.2% |
| Moroccans | 23.2 /100 | #200 | Fair 84.2% |
| British | 23.0 /100 | #201 | Fair 84.2% |
| Immigrants | Uzbekistan | 22.8 /100 | #202 | Fair 84.2% |
| Immigrants | South Eastern Asia | 22.4 /100 | #203 | Fair 84.2% |
| Canadians | 19.9 /100 | #204 | Poor 84.2% |
| Immigrants | Canada | 19.6 /100 | #205 | Poor 84.2% |
| Immigrants | Costa Rica | 19.5 /100 | #206 | Poor 84.2% |
| Laotians | 19.0 /100 | #207 | Poor 84.2% |
| Immigrants | North America | 18.1 /100 | #208 | Poor 84.2% |
| Swiss | 17.4 /100 | #209 | Poor 84.2% |