Icelander vs Immigrants from Greece 6th Grade
COMPARE
Icelander
Immigrants from Greece
6th Grade
6th Grade Comparison
Icelanders
Immigrants from Greece
97.6%
6TH GRADE
99.3/ 100
METRIC RATING
78th/ 347
METRIC RANK
97.2%
6TH GRADE
77.8/ 100
METRIC RATING
148th/ 347
METRIC RANK
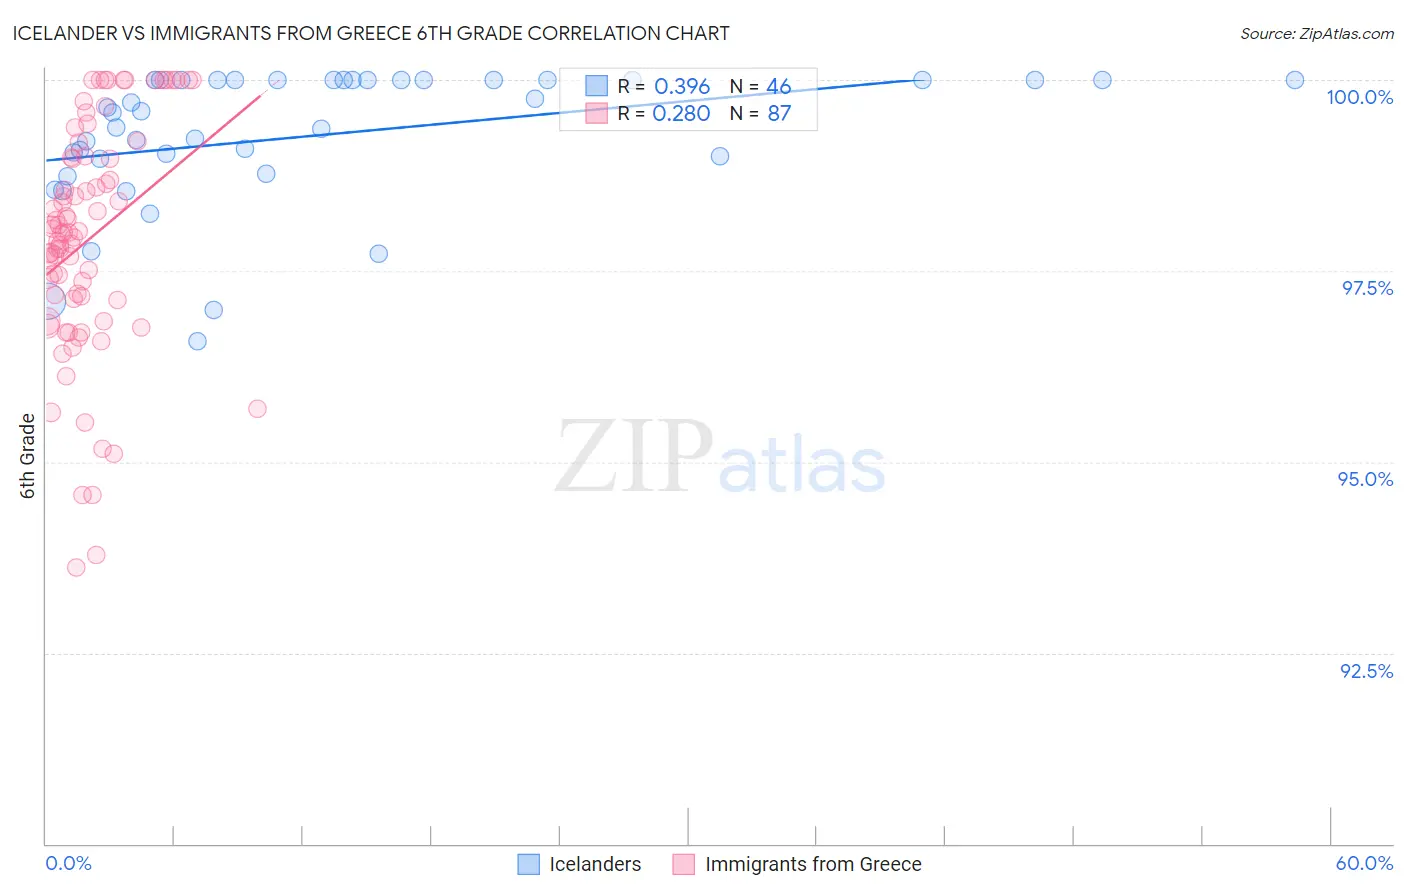
Icelander vs Immigrants from Greece 6th Grade Correlation Chart
The statistical analysis conducted on geographies consisting of 159,668,975 people shows a mild positive correlation between the proportion of Icelanders and percentage of population with at least 6th grade education in the United States with a correlation coefficient (R) of 0.396 and weighted average of 97.6%. Similarly, the statistical analysis conducted on geographies consisting of 216,879,847 people shows a weak positive correlation between the proportion of Immigrants from Greece and percentage of population with at least 6th grade education in the United States with a correlation coefficient (R) of 0.280 and weighted average of 97.2%, a difference of 0.42%.
6th Grade Correlation Summary
| Measurement | Icelander | Immigrants from Greece |
| Minimum | 96.6% | 93.6% |
| Maximum | 100.0% | 100.0% |
| Range | 3.4% | 6.4% |
| Mean | 99.3% | 97.9% |
| Median | 99.6% | 98.0% |
| Interquartile 25% (IQ1) | 99.0% | 97.1% |
| Interquartile 75% (IQ3) | 100.0% | 99.0% |
| Interquartile Range (IQR) | 1.0% | 1.9% |
| Standard Deviation (Sample) | 0.90% | 1.5% |
| Standard Deviation (Population) | 0.89% | 1.5% |
Similar Demographics by 6th Grade
Demographics Similar to Icelanders by 6th Grade
In terms of 6th grade, the demographic groups most similar to Icelanders are Immigrants from Lithuania (97.6%, a difference of 0.0%), Immigrants from India (97.6%, a difference of 0.0%), Ukrainian (97.6%, a difference of 0.010%), Immigrants from England (97.6%, a difference of 0.010%), and Osage (97.6%, a difference of 0.010%).
| Demographics | Rating | Rank | 6th Grade |
| Chickasaw | 99.5 /100 | #71 | Exceptional 97.6% |
| Macedonians | 99.4 /100 | #72 | Exceptional 97.6% |
| Cherokee | 99.4 /100 | #73 | Exceptional 97.6% |
| Immigrants | Netherlands | 99.4 /100 | #74 | Exceptional 97.6% |
| Ukrainians | 99.4 /100 | #75 | Exceptional 97.6% |
| Immigrants | England | 99.4 /100 | #76 | Exceptional 97.6% |
| Immigrants | Lithuania | 99.3 /100 | #77 | Exceptional 97.6% |
| Icelanders | 99.3 /100 | #78 | Exceptional 97.6% |
| Immigrants | India | 99.3 /100 | #79 | Exceptional 97.6% |
| Osage | 99.3 /100 | #80 | Exceptional 97.6% |
| Lumbee | 99.2 /100 | #81 | Exceptional 97.6% |
| Zimbabweans | 99.1 /100 | #82 | Exceptional 97.6% |
| Potawatomi | 99.1 /100 | #83 | Exceptional 97.6% |
| Shoshone | 99.0 /100 | #84 | Exceptional 97.6% |
| Delaware | 98.9 /100 | #85 | Exceptional 97.6% |
Demographics Similar to Immigrants from Greece by 6th Grade
In terms of 6th grade, the demographic groups most similar to Immigrants from Greece are Immigrants from South Central Asia (97.2%, a difference of 0.0%), Hopi (97.2%, a difference of 0.010%), Immigrants from Israel (97.2%, a difference of 0.010%), Spaniard (97.2%, a difference of 0.020%), and Immigrants from Bosnia and Herzegovina (97.2%, a difference of 0.020%).
| Demographics | Rating | Rank | 6th Grade |
| Seminole | 84.8 /100 | #141 | Excellent 97.2% |
| Jordanians | 84.6 /100 | #142 | Excellent 97.2% |
| Pima | 82.9 /100 | #143 | Excellent 97.2% |
| Israelis | 82.9 /100 | #144 | Excellent 97.2% |
| Spaniards | 80.1 /100 | #145 | Excellent 97.2% |
| Hopi | 78.8 /100 | #146 | Good 97.2% |
| Immigrants | South Central Asia | 78.1 /100 | #147 | Good 97.2% |
| Immigrants | Greece | 77.8 /100 | #148 | Good 97.2% |
| Immigrants | Israel | 76.0 /100 | #149 | Good 97.2% |
| Immigrants | Bosnia and Herzegovina | 74.8 /100 | #150 | Good 97.2% |
| French American Indians | 74.0 /100 | #151 | Good 97.2% |
| Immigrants | Jordan | 73.0 /100 | #152 | Good 97.2% |
| Immigrants | Eastern Europe | 72.6 /100 | #153 | Good 97.2% |
| Soviet Union | 71.5 /100 | #154 | Good 97.2% |
| Ute | 71.1 /100 | #155 | Good 97.1% |